Try Fund Library Premium
Free with a 30 day trial!
Gain access to
- Unlimited Watchlists
- Advanced Search Filtering
- Fund Comparisons
- Portfolio Scenarios
- Customizable PDF Reports
- Portfolio Rebalancer new
Counsel Income ETF Portfolio Series F
Global Fixed Inc Balanced
 Click for more information on Fundata’s FundGrade
FundGrade C
Click for more information on Fundata’s FundGrade.
|
NAVPS (10-20-2026) |
$10.35 |
|---|---|
| Change |
$0.03
(0.28%)
|
As at September 30, 2026
As at July 31, 2026
 Loading......
Legend
Compare Options
Fund Returns
Inception Return (July 20, 2012): 4.74%
| Row Heading | Return | Annualized Return | ||||||||||||
|---|---|---|---|---|---|---|---|---|---|---|---|---|---|---|
| 1 Mth | 3 Mth | 6 Mth | YTD | 1 Yr | 2 Yr | 3 Yr | 4 Yr | 5 Yr | 6 Yr | 7 Yr | 8 Yr | 9 Yr | 10 Yr | |
| Fund | -1.09% | -1.35% | 2.89% | 4.39% | 5.42% | 5.85% | 9.04% | 7.63% | 4.58% | 5.07% | 4.15% | 4.20% | 3.98% | 3.78% |
| Benchmark | -0.05% | -2.05% | 3.71% | 3.97% | 3.20% | 6.15% | 9.47% | 8.27% | 3.25% | 2.73% | 3.55% | 4.23% | 4.30% | 3.70% |
| Category Average | -1.23% | -1.60% | 3.13% | 3.01% | 3.69% | 5.32% | 8.69% | 7.42% | 3.27% | 3.81% | 3.88% | 4.06% | 3.83% | 3.67% |
| Category Rank | 598 / 963 | 334 / 957 | 623 / 951 | 261 / 945 | 223 / 941 | 448 / 917 | 438 / 868 | 457 / 851 | 172 / 801 | 160 / 748 | 310 / 710 | 306 / 623 | 274 / 550 | 237 / 474 |
| Quartile Ranking | 3 | 2 | 3 | 2 | 1 | 2 | 3 | 3 | 1 | 1 | 2 | 2 | 2 | 2 |
Monthly Return
| Return % | Oct | Nov | Dec | Jan | Feb | Mar | Apr | May | Jun | Jul | Aug | Sep |
|---|---|---|---|---|---|---|---|---|---|---|---|---|
| Fund | 0.49% | 1.01% | -0.51% | 1.20% | 2.65% | -2.34% | 1.30% | 1.44% | 1.50% | 0.07% | -0.33% | -1.09% |
| Benchmark | 1.00% | -0.23% | -1.50% | 0.33% | 1.93% | -1.98% | 0.82% | 2.66% | 2.30% | -1.80% | -0.21% | -0.05% |
Best Monthly Return Since Inception
4.97% (January 2015)
Worst Monthly Return Since Inception
-7.38% (March 2020)
Calendar Return (%)
| Return % | 2016 | 2017 | 2018 | 2019 | 2020 | 2021 | 2022 | 2023 | 2024 | 2025 |
|---|---|---|---|---|---|---|---|---|---|---|
| Fund | 6.22% | 5.09% | -1.26% | 7.27% | 0.89% | 7.63% | -7.04% | 7.30% | 9.06% | 6.58% |
| Benchmark | 0.39% | 3.81% | 5.53% | 6.30% | 9.09% | -0.49% | -11.13% | 6.74% | 11.56% | 6.36% |
| Category Average | 4.39% | 5.49% | -2.85% | 9.97% | 7.08% | 4.51% | -11.10% | 7.71% | 8.38% | 7.43% |
| Quartile Ranking | 1 | 2 | 2 | 4 | 4 | 1 | 1 | 3 | 3 | 3 |
| Category Rank | 45/ 424 | 184/ 486 | 201/ 564 | 620/ 663 | 700/ 715 | 50/ 767 | 35/ 810 | 571/ 853 | 488/ 904 | 587/ 931 |
Best Calendar Return (Last 10 years)
9.06% (2024)
Worst Calendar Return (Last 10 years)
-7.04% (2022)
Asset Allocation
| Name | Percent |
|---|---|
| Canadian Government Bonds | 25.39 |
| Canadian Corporate Bonds | 23.67 |
| US Equity | 11.64 |
| Canadian Equity | 10.59 |
| International Equity | 8.97 |
| Other | 19.74 |
Sector Allocation
| Name | Percent |
|---|---|
| Fixed Income | 61.25 |
| Financial Services | 7.98 |
| Healthcare | 4.99 |
| Real Estate | 4.92 |
| Energy | 4.07 |
| Other | 16.79 |
Geographic Allocation
| Name | Percent |
|---|---|
| North America | 79.90 |
| Asia | 6.95 |
| Europe | 6.32 |
| Multi-National | 3.44 |
| Latin America | 2.03 |
| Other | 1.36 |
Top Holdings
| Name | Percent |
|---|---|
| Counsel Canadian Core Fixed Income Series O | 42.97 |
| Counsel Global Dividend Series O | 18.44 |
| Counsel Canadian Dividend Series O | 11.00 |
| Counsel Global Fixed Income Series O | 7.00 |
| Counsel Short Term Bond Series O | 6.45 |
| Counsel North American High Yield Bond Series O | 6.25 |
| Counsel Global Real Estate Series O | 4.32 |
| Sagard Private Credit LP | 3.38 |
| Canadian Dollars | 0.13 |
| United States Dollars | 0.06 |
Equity Style
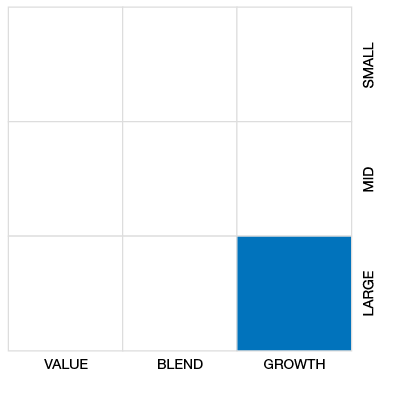
Fixed Income Style

Risk vs Return (3 Yr)
Counsel Income ETF Portfolio Series F
Median
Other - Global Fixed Inc Balanced
3 Yr Annualized
| Standard Deviation | 5.17% | 6.14% | 5.70% |
|---|---|---|---|
| Beta | 0.88 | 0.76 | 0.62 |
| Alpha | 0.01 | 0.02 | 0.01 |
| Rsquared | 0.72% | 0.66% | 0.43% |
| Sharpe | 1.07 | 0.26 | 0.34 |
| Sortino | 2.14 | 0.41 | 0.21 |
| Treynor | 0.06 | 0.02 | 0.03 |
| Tax Efficiency | 79.79% | 59.16% | 55.01% |
| Volatility |

|
|
|
Risk Rating

Annualized Key Ratio Period Comparison
| Key Ratio | 1 Yr | 3 Yr | 5 Yr | 10 Yr |
|---|---|---|---|---|
| Standard Deviation | 4.71% | 5.17% | 6.14% | 5.70% |
| Beta | 0.68 | 0.88 | 0.76 | 0.62 |
| Alpha | 0.03 | 0.01 | 0.02 | 0.01 |
| Rsquared | 0.60% | 0.72% | 0.66% | 0.43% |
| Sharpe | 0.67 | 1.07 | 0.26 | 0.34 |
| Sortino | 0.78 | 2.14 | 0.41 | 0.21 |
| Treynor | 0.05 | 0.06 | 0.02 | 0.03 |
| Tax Efficiency | 71.45% | 79.79% | 59.16% | 55.01% |
Fund Details
| Start Date | July 20, 2012 |
|---|---|
| Instrument Type | Mutual Fund |
| Share Class | Fee Based Advice |
| Legal Status | Trust |
| Sales Status | Open |
| Currency | CAD |
| Distribution Frequency | Monthly |
| Assets ($mil) | $31 |
Fund Codes
| FundServ Code | Load Code | Sales Status |
|---|---|---|
| CGF160 | NL | Open |
Investment Objectives
IPC Conservative Income Portfolio seeks to provide regular income with the potential for long-term capital growth. The Fund will invest either directly, or through securities of other mutual funds, primarily in Canadian, U.S. and international fixed-income securities and equity and equity-like securities that are expected to produce income.
Investment Strategy
The Fund's asset mix will generally be kept within the following ranges: · 10% - 30% equity securities, · 70% - 90% fixed income securities. The Fund is built upon long-term strategic allocations to different equity markets, fixed-income markets, and other asset classes. The Fund may be over or underweight equity or fixed income or other asset class holdings when we believe it is prudent to do so based on market signals and other factors.
Portfolio Management
| Portfolio Manager |
Canada Life Investment Management Ltd. |
|---|---|
| Sub-Advisor |
Mackenzie Financial Corporation |
Management and Organization
| Fund Manager |
Canada Life Investment Management Ltd. |
|---|---|
| Custodian |
Canadian Imperial Bank of Commerce |
| Registrar |
Mackenzie Financial Corporation |
| Distributor |
- |
Investment Minimums
| RSP Eligible | Yes |
|---|---|
| PAC Allowed | Yes |
| PAC Initial Investment | 50 |
| PAC Subsequent | 50 |
| SWP Allowed | Yes |
| SWP Min Balance | 5,000 |
| SWP Min Withdrawal | 0 |
Fees
| MER | 0.94% |
|---|---|
| Management Fee | 0.35% |
| Load | No Load |
| FE Max | - |
| DSC Max | - |
| Trailer Fee Max (FE) | - |
| Trailer Fee Max (DSC) | - |
| Trailer Fee Max (NL) | 0.00% |
| Trailer Fee Max (LL) | - |
Try Fund Library Premium
Free with a 30 day trial!
Gain access to
- Unlimited Watchlists
- Advanced Search Filtering
- Fund Comparisons
- Portfolio Scenarios
- Customizable PDF Reports
- Portfolio Rebalancer new