Try Fund Library Premium
Free with a 30 day trial!
Gain access to
- Unlimited Watchlists
- Advanced Search Filtering
- Fund Comparisons
- Portfolio Scenarios
- Customizable PDF Reports
- Portfolio Rebalancer new
Canada Life Visio Global Balanced Pool F Series
Global Neutral Balanced
 Click for more information on Fundata’s FundGrade
FundGrade B
Click for more information on Fundata’s FundGrade.
 Click for more information on Fundata’s ESG Grade
Fundata ESG Grade D
Click for more information on Fundata’s ESG Grade.


FundGrade A+® Rating Recipient
2022
Click for more information on Fundata’s FundGrade
|
NAVPS (10-20-2026) |
$12.77 |
|---|---|
| Change |
$0.00
(-0.03%)
|
As at September 30, 2026
As at July 31, 2026
As at September 30, 2026
 Loading......
Legend
Compare Options
Fund Returns
Inception Return (July 14, 2017): 7.16%
| Row Heading | Return | Annualized Return | ||||||||||||
|---|---|---|---|---|---|---|---|---|---|---|---|---|---|---|
| 1 Mth | 3 Mth | 6 Mth | YTD | 1 Yr | 2 Yr | 3 Yr | 4 Yr | 5 Yr | 6 Yr | 7 Yr | 8 Yr | 9 Yr | 10 Yr | |
| Fund | -0.64% | 0.54% | 8.20% | 6.92% | 8.06% | 10.77% | 14.30% | 12.14% | 8.08% | 8.92% | 7.84% | 7.57% | 7.30% | - |
| Benchmark | 0.35% | -0.75% | 9.44% | 9.10% | 9.32% | 11.53% | 14.97% | 13.80% | 7.48% | 7.64% | 7.95% | 7.84% | 7.90% | 7.52% |
| Category Average | -0.99% | -0.81% | 6.26% | 6.17% | 7.28% | 8.59% | 11.93% | 10.64% | 5.69% | 6.71% | 6.31% | 6.10% | 5.92% | 5.83% |
| Category Rank | 937 / 1,788 | 174 / 1,761 | 432 / 1,752 | 848 / 1,734 | 806 / 1,719 | 452 / 1,643 | 327 / 1,579 | 467 / 1,547 | 215 / 1,445 | 200 / 1,307 | 330 / 1,246 | 304 / 1,128 | 275 / 998 | - |
| Quartile Ranking | 3 | 1 | 1 | 2 | 2 | 2 | 1 | 2 | 1 | 1 | 2 | 2 | 2 | - |
Monthly Return
| Return % | Oct | Nov | Dec | Jan | Feb | Mar | Apr | May | Jun | Jul | Aug | Sep |
|---|---|---|---|---|---|---|---|---|---|---|---|---|
| Fund | 0.49% | 0.82% | -0.24% | 1.63% | 1.48% | -4.18% | 3.43% | 3.24% | 0.79% | 0.44% | 0.74% | -0.64% |
| Benchmark | 1.71% | -0.22% | -1.26% | 1.04% | 2.06% | -3.32% | 3.53% | 4.15% | 2.26% | -1.63% | 0.55% | 0.35% |
Best Monthly Return Since Inception
5.99% (April 2020)
Worst Monthly Return Since Inception
-8.05% (March 2020)
Calendar Return (%)
| Return % | 2016 | 2017 | 2018 | 2019 | 2020 | 2021 | 2022 | 2023 | 2024 | 2025 |
|---|---|---|---|---|---|---|---|---|---|---|
| Fund | - | - | -2.48% | 12.77% | 4.84% | 13.67% | -7.75% | 8.64% | 16.67% | 11.42% |
| Benchmark | 2.39% | 8.66% | 2.68% | 12.26% | 11.12% | 6.48% | -11.62% | 11.69% | 17.48% | 10.42% |
| Category Average | 5.05% | 7.69% | -3.99% | 13.52% | 7.16% | 9.69% | -11.26% | 9.53% | 12.15% | 9.84% |
| Quartile Ranking | - | - | 2 | 3 | 4 | 1 | 1 | 3 | 1 | 2 |
| Category Rank | - | - | 409/ 1,053 | 618/ 1,169 | 964/ 1,258 | 166/ 1,338 | 251/ 1,481 | 1,062/ 1,555 | 196/ 1,602 | 516/ 1,658 |
Best Calendar Return (Last 10 years)
16.67% (2024)
Worst Calendar Return (Last 10 years)
-7.75% (2022)
Asset Allocation
| Name | Percent |
|---|---|
| US Equity | 32.35 |
| International Equity | 21.14 |
| Canadian Corporate Bonds | 19.10 |
| Canadian Government Bonds | 17.99 |
| Foreign Corporate Bonds | 4.43 |
| Other | 4.99 |
Sector Allocation
| Name | Percent |
|---|---|
| Fixed Income | 43.16 |
| Technology | 15.40 |
| Financial Services | 9.75 |
| Consumer Services | 5.90 |
| Healthcare | 5.16 |
| Other | 20.63 |
Geographic Allocation
| Name | Percent |
|---|---|
| North America | 78.09 |
| Europe | 13.90 |
| Asia | 6.35 |
| Latin America | 1.66 |
Top Holdings
| Name | Percent |
|---|---|
| Canada Life Canadian Core Plus Bond Fund A | 44.16 |
| Alphabet Inc Cl A | 2.16 |
| Microsoft Corp | 1.60 |
| Apple Inc | 1.53 |
| NVIDIA Corp | 1.51 |
| Amazon.com Inc | 1.18 |
| BNP Paribas SA | 1.11 |
| Cash and Cash Equivalents | 0.97 |
| Meta Platforms Inc Cl A | 0.92 |
| JPMorgan Chase & Co | 0.86 |
Equity Style
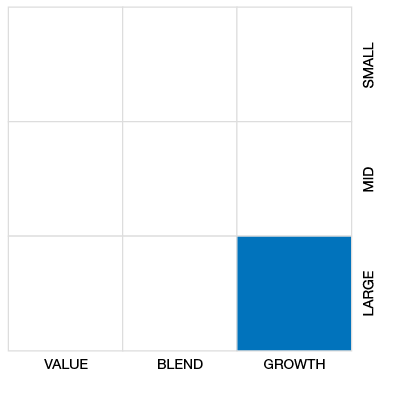
Fixed Income Style

Risk vs Return (3 Yr)
Canada Life Visio Global Balanced Pool F Series
Median
Other - Global Neutral Balanced
3 Yr Annualized
| Standard Deviation | 7.01% | 8.41% | - |
|---|---|---|---|
| Beta | 0.97 | 0.93 | - |
| Alpha | 0.00 | 0.01 | - |
| Rsquared | 0.85% | 0.82% | - |
| Sharpe | 1.48 | 0.61 | - |
| Sortino | 2.88 | 0.95 | - |
| Treynor | 0.11 | 0.05 | - |
| Tax Efficiency | 83.50% | 73.29% | - |
| Volatility |

|

|
- |
Risk Rating

Annualized Key Ratio Period Comparison
| Key Ratio | 1 Yr | 3 Yr | 5 Yr | 10 Yr |
|---|---|---|---|---|
| Standard Deviation | 6.77% | 7.01% | 8.41% | - |
| Beta | 0.78 | 0.97 | 0.93 | - |
| Alpha | 0.01 | 0.00 | 0.01 | - |
| Rsquared | 0.74% | 0.85% | 0.82% | - |
| Sharpe | 0.85 | 1.48 | 0.61 | - |
| Sortino | 1.10 | 2.88 | 0.95 | - |
| Treynor | 0.07 | 0.11 | 0.05 | - |
| Tax Efficiency | 83.28% | 83.50% | 73.29% | - |
Fundata ESG Metrics
Fundata ESG Score
The E, S, and G scores are averaged for each security in the portfolio, to arrive at an ESG score for each security. We take the portfolio weighted average of the ESG scores for each fund and rank them against their peers to arrive at the Fundata ESG Score from 0-100.
Fundata E Score
Three scores under the Environment bucket are averaged to yield the Fundata Environment Score for each fund from 0-100: (1) Pollution Prevention, (2) Environmental Transparency, (3) Resource Efficiency.
Fundata S Score
Six scores under the Social bucket are averaged to yield the Fundata Social Score for each fund from 0-100. (1) Compensation and Satisfaction, (2) Diversity and Rights, (3) Education and Work Conditions, (4) Community and Charity, (5) Human Rights, (6) Sustainability Integration.
Fundata G Score
Three scores under the governance bucket are averaged to yield the Fundata Governance Score for each fund from 0-100: (1) Board Effectiveness, (2) Management Ethics, (3) Disclosure and Accountability.
Powered by OWL Analytics. For more information, please contact Fundata Canada.
Fund Details
| Start Date | July 14, 2017 |
|---|---|
| Instrument Type | Mutual Fund |
| Share Class | Fee Based Advice |
| Legal Status | Trust |
| Sales Status | Open |
| Currency | CAD |
| Distribution Frequency | Annual |
| Assets ($mil) | $202 |
Fund Codes
| FundServ Code | Load Code | Sales Status |
|---|---|---|
| MAX2159 | NL | Open |
Investment Objectives
The fund seeks long-termcapital growth and income by investing primarily in equities issued by companies around the world and Canadian fixed income securities directly or through other investment funds.
Investment Strategy
The Fund’s asset mix will generally be kept within the following ranges:; • 40%-60% equity securities.; • 40%-60% fixed income securities.; The Fund uses a multi sub-advisor approach with each sub-advisor managing a portion of the Fund.; Mackenzie Financial Corporation - Canadian Fixed Income – Generally, the sub-advisor uses two investment strategies.
Portfolio Management
| Portfolio Manager |
Canada Life Investment Management Ltd.
|
|---|---|
| Sub-Advisor |
Mackenzie Financial Corporation
Brandywine Global Investment Management, LLC
Keyridge Asset Management Limited ILIM
|
Management and Organization
| Fund Manager |
Canada Life Investment Management Ltd. |
|---|---|
| Custodian |
Canadian Imperial Bank of Commerce |
| Registrar |
Mackenzie Financial Corporation |
| Distributor |
Quadrus Investment Services Limited IPC Investment Corporation IPC Securities Corporation |
Investment Minimums
| RSP Eligible | Yes |
|---|---|
| PAC Allowed | Yes |
| PAC Initial Investment | 25 |
| PAC Subsequent | 25 |
| SWP Allowed | Yes |
| SWP Min Balance | 5,000 |
| SWP Min Withdrawal | 50 |
Fees
| MER | 0.97% |
|---|---|
| Management Fee | 0.70% |
| Load | No Load |
| FE Max | - |
| DSC Max | - |
| Trailer Fee Max (FE) | - |
| Trailer Fee Max (DSC) | - |
| Trailer Fee Max (NL) | 0.00% |
| Trailer Fee Max (LL) | - |
Try Fund Library Premium
Free with a 30 day trial!
Gain access to
- Unlimited Watchlists
- Advanced Search Filtering
- Fund Comparisons
- Portfolio Scenarios
- Customizable PDF Reports
- Portfolio Rebalancer new