Try Fund Library Premium
Free with a 30 day trial!
Gain access to
- Unlimited Watchlists
- Advanced Search Filtering
- Fund Comparisons
- Portfolio Scenarios
- Customizable PDF Reports
- Portfolio Rebalancer new
CI Morningstar International Value Index ETF - Hedged Common Units
International Equity
 Click for more information on Fundata’s FundGrade
FundGrade A
Click for more information on Fundata’s FundGrade.
 Click for more information on Fundata’s ESG Grade
Fundata ESG Grade E
Click for more information on Fundata’s ESG Grade.

FundGrade A+® Rating Recipient
2025, 2017
Click for more information on Fundata’s FundGrade
|
NAVPS (06-19-2026) |
$52.69 |
|---|---|
| Change |
$0.06
(0.11%)
|
As at May 31, 2026
As at May 31, 2026
As at May 31, 2026
Legend
Compare Options
Fund Returns
Inception Return (November 13, 2014): 11.45%
| Row Heading | Return | Annualized Return | ||||||||||||
|---|---|---|---|---|---|---|---|---|---|---|---|---|---|---|
| 1 Mth | 3 Mth | 6 Mth | YTD | 1 Yr | 2 Yr | 3 Yr | 4 Yr | 5 Yr | 6 Yr | 7 Yr | 8 Yr | 9 Yr | 10 Yr | |
| Fund | 2.89% | -2.29% | 14.19% | 11.12% | 38.26% | 26.47% | 30.05% | 24.46% | 20.14% | 21.73% | 16.31% | 12.09% | 12.12% | 13.20% |
| Benchmark | 7.01% | 3.55% | 18.05% | 16.55% | 33.17% | 23.10% | 21.27% | 18.20% | 12.37% | 14.11% | 11.98% | 9.95% | 9.35% | 10.42% |
| Category Average | 3.78% | 0.05% | 7.68% | 7.40% | 15.35% | 13.50% | 14.12% | 12.64% | 7.57% | 10.17% | 8.72% | 7.15% | 6.63% | 7.73% |
| Category Rank | 692 / 870 | 763 / 860 | 61 / 845 | 144 / 850 | 8 / 796 | 10 / 747 | 2 / 717 | 2 / 691 | 1 / 675 | 1 / 639 | 2 / 606 | 3 / 544 | 2 / 503 | 2 / 448 |
| Quartile Ranking | 4 | 4 | 1 | 1 | 1 | 1 | 1 | 1 | 1 | 1 | 1 | 1 | 1 | 1 |
Monthly Return
| Return % | Jun | Jul | Aug | Sep | Oct | Nov | Dec | Jan | Feb | Mar | Apr | May |
|---|---|---|---|---|---|---|---|---|---|---|---|---|
| Fund | 2.37% | 4.57% | 4.64% | 1.93% | 1.45% | 4.52% | 2.76% | 4.64% | 8.69% | -6.95% | 2.06% | 2.89% |
| Benchmark | 2.18% | 0.51% | 3.32% | 3.56% | 2.68% | -0.03% | 1.29% | 5.56% | 6.62% | -9.73% | 7.20% | 7.01% |
Best Monthly Return Since Inception
13.15% (November 2020)
Worst Monthly Return Since Inception
-19.66% (March 2020)
Calendar Return (%)
| Return % | 2016 | 2017 | 2018 | 2019 | 2020 | 2021 | 2022 | 2023 | 2024 | 2025 |
|---|---|---|---|---|---|---|---|---|---|---|
| Fund | 7.79% | 23.82% | -15.56% | 17.27% | -14.48% | 19.82% | 1.92% | 25.37% | 19.18% | 43.82% |
| Benchmark | -1.70% | 18.37% | -6.81% | 16.27% | 8.01% | 8.97% | -10.67% | 15.74% | 11.18% | 27.50% |
| Category Average | -2.56% | 17.84% | -8.91% | 17.54% | 7.87% | 8.64% | -12.60% | 13.75% | 10.76% | 17.77% |
| Quartile Ranking | 1 | 1 | 4 | 3 | 4 | 1 | 1 | 1 | 1 | 1 |
| Category Rank | 8/ 408 | 33/ 469 | 509/ 529 | 315/ 586 | 631/ 631 | 24/ 658 | 6/ 678 | 4/ 703 | 18/ 738 | 2/ 769 |
Best Calendar Return (Last 10 years)
43.82% (2025)
Worst Calendar Return (Last 10 years)
-15.56% (2018)
Asset Allocation
| Name | Percent |
|---|---|
| International Equity | 98.28 |
| Cash and Equivalents | 1.23 |
| Income Trust Units | 0.50 |
| Other | -0.01 |
Sector Allocation
| Name | Percent |
|---|---|
| Financial Services | 16.22 |
| Industrial Services | 14.41 |
| Consumer Goods | 13.16 |
| Utilities | 9.81 |
| Consumer Services | 9.21 |
| Other | 37.19 |
Geographic Allocation
| Name | Percent |
|---|---|
| Asia | 50.01 |
| Europe | 49.46 |
| Africa and Middle East | 0.39 |
| North America | 0.13 |
| Other | 0.01 |
Top Holdings
| Name | Percent |
|---|---|
| Nisshinbo Holdings Inc | 0.75 |
| Ferrotec Holdings Corp | 0.71 |
| UACJ Corp | 0.66 |
| Aurubis AG | 0.65 |
| NHK Spring Co Ltd | 0.64 |
| Ssab AB Cl A | 0.64 |
| GS Yuasa Corp | 0.63 |
| ArcelorMittal SA | 0.63 |
| Valeo SE | 0.62 |
| Oki Electric Industry Co Ltd | 0.61 |
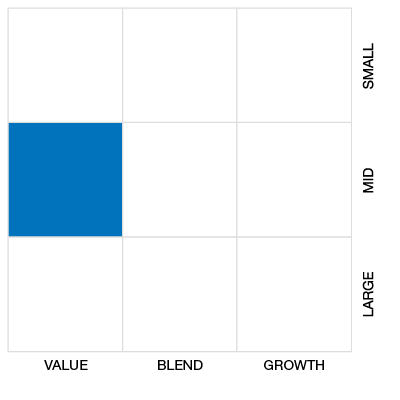
Equity Style
Fixed Income Style

Risk vs Return (3 Yr)
CI Morningstar International Value Index ETF - Hedged Common Units
Median
Other - International Equity
3 Yr Annualized
| Standard Deviation | 10.19% | 11.20% | 15.12% |
|---|---|---|---|
| Beta | 0.58 | 0.63 | 0.92 |
| Alpha | 0.15 | 0.11 | 0.04 |
| Rsquared | 0.46% | 0.55% | 0.57% |
| Sharpe | 2.31 | 1.45 | 0.78 |
| Sortino | 4.62 | 2.55 | 0.99 |
| Treynor | 0.40 | 0.26 | 0.13 |
| Tax Efficiency | 95.43% | 94.29% | 93.22% |
| Volatility |

|
|

|
Risk Rating

Annualized Key Ratio Period Comparison
| Key Ratio | 1 Yr | 3 Yr | 5 Yr | 10 Yr |
|---|---|---|---|---|
| Standard Deviation | 12.62% | 10.19% | 11.20% | 15.12% |
| Beta | 0.60 | 0.58 | 0.63 | 0.92 |
| Alpha | 0.16 | 0.15 | 0.11 | 0.04 |
| Rsquared | 0.57% | 0.46% | 0.55% | 0.57% |
| Sharpe | 2.47 | 2.31 | 1.45 | 0.78 |
| Sortino | - | 4.62 | 2.55 | 0.99 |
| Treynor | 0.52 | 0.40 | 0.26 | 0.13 |
| Tax Efficiency | 97.00% | 95.43% | 94.29% | 93.22% |
Fundata ESG Metrics
Fundata ESG Score
The E, S, and G scores are averaged for each security in the portfolio, to arrive at an ESG score for each security. We take the portfolio weighted average of the ESG scores for each fund and rank them against their peers to arrive at the Fundata ESG Score from 0-100.
Fundata E Score
Three scores under the Environment bucket are averaged to yield the Fundata Environment Score for each fund from 0-100: (1) Pollution Prevention, (2) Environmental Transparency, (3) Resource Efficiency.
Fundata S Score
Six scores under the Social bucket are averaged to yield the Fundata Social Score for each fund from 0-100. (1) Compensation and Satisfaction, (2) Diversity and Rights, (3) Education and Work Conditions, (4) Community and Charity, (5) Human Rights, (6) Sustainability Integration.
Fundata G Score
Three scores under the governance bucket are averaged to yield the Fundata Governance Score for each fund from 0-100: (1) Board Effectiveness, (2) Management Ethics, (3) Disclosure and Accountability.
Powered by OWL Analytics. For more information, please contact Fundata Canada.
Fund Details
| Start Date | November 13, 2014 |
|---|---|
| Instrument Type | Exchange Traded Fund |
| Share Class | Do-It-Yourself |
| Legal Status | Trust |
| Sales Status | Open |
| Currency | CAD |
| Distribution Frequency | Quarterly |
| Assets ($mil) | $912 |
Fund Codes
| FundServ Code | Load Code | Sales Status |
|---|---|---|
| N/A | ||
Investment Objectives
The CI Morningstar International Value Index ETF has been designed to replicate the performance of the Morningstar® Developed Markets ex-North America Target Value Index™ (the “Index”) (or Morningstar® Developed Markets ex-North America Target Value Index™ (USD) in the case of the Unhedged US$ Common Units), net of expenses.
Investment Strategy
The CI Morningstar International Value Index ETF invests in equity securities of the largest and most liquid issuers from countries classified by Morningstar as developed markets, excluding the U.S. and Canada, based on proprietary research generated by Morningstar, and is designed to provide diversified exposure to issuers from developed markets, excluding the U.S. and Canada. The exposure in relation to the Unhedged US$ Common Units to currencies other than the U.S. dollar will not be hedged b
Portfolio Management
| Portfolio Manager |
CI Global Asset Management |
|---|---|
| Sub-Advisor |
- |
Management and Organization
| Fund Manager |
CI Global Asset Management |
|---|---|
| Custodian |
CIBC Mellon Trust Company |
| Registrar |
TSX Trust Company |
| Distributor |
- |
Investment Minimums
| RSP Eligible | Yes |
|---|---|
| PAC Allowed | No |
| PAC Initial Investment | - |
| PAC Subsequent | - |
| SWP Allowed | No |
| SWP Min Balance | - |
| SWP Min Withdrawal | - |
Fees
| MER | 0.66% |
|---|---|
| Management Fee | 0.60% |
| Load | No Load |
| FE Max | - |
| DSC Max | - |
| Trailer Fee Max (FE) | - |
| Trailer Fee Max (DSC) | - |
| Trailer Fee Max (NL) | - |
| Trailer Fee Max (LL) | - |
Try Fund Library Premium
Free with a 30 day trial!
Gain access to
- Unlimited Watchlists
- Advanced Search Filtering
- Fund Comparisons
- Portfolio Scenarios
- Customizable PDF Reports
- Portfolio Rebalancer new
