Try Fund Library Premium
Free with a 30 day trial!
Gain access to
- Unlimited Watchlists
- Advanced Search Filtering
- Fund Comparisons
- Portfolio Scenarios
- Customizable PDF Reports
- Portfolio Rebalancer new
CI Canadian REIT Fund Series A
Real Estate Equity
 Click for more information on Fundata’s FundGrade
FundGrade B
Click for more information on Fundata’s FundGrade.

FundGrade A+® Rating Recipient
2019, 2018, 2017, 2016, 2013
Click for more information on Fundata’s FundGrade
|
NAVPS (06-18-2026) |
$19.48 |
|---|---|
| Change |
$0.17
(0.90%)
|
As at May 31, 2026
As at May 31, 2026
Legend
Compare Options
Fund Returns
Inception Return (June 07, 2010): 8.52%
| Row Heading | Return | Annualized Return | ||||||||||||
|---|---|---|---|---|---|---|---|---|---|---|---|---|---|---|
| 1 Mth | 3 Mth | 6 Mth | YTD | 1 Yr | 2 Yr | 3 Yr | 4 Yr | 5 Yr | 6 Yr | 7 Yr | 8 Yr | 9 Yr | 10 Yr | |
| Fund | 0.36% | 0.85% | 7.89% | 7.53% | 9.63% | 11.84% | 7.13% | 1.63% | 2.47% | 6.45% | 3.78% | 4.57% | 4.68% | 5.44% |
| Benchmark | 0.79% | 0.47% | 6.49% | 10.24% | 15.27% | 14.09% | 12.13% | 6.86% | 6.09% | 8.34% | 4.48% | 5.49% | 4.85% | 4.88% |
| Category Average | 0.45% | 0.13% | 6.66% | 8.78% | 10.49% | 10.59% | 8.32% | 3.35% | 3.09% | 5.56% | 3.38% | 4.26% | 4.04% | 4.16% |
| Category Rank | 72 / 149 | 36 / 149 | 28 / 149 | 116 / 149 | 92 / 148 | 40 / 142 | 114 / 137 | 119 / 135 | 98 / 126 | 44 / 124 | 56 / 118 | 50 / 104 | 46 / 101 | 28 / 96 |
| Quartile Ranking | 2 | 1 | 1 | 4 | 3 | 2 | 4 | 4 | 4 | 2 | 2 | 2 | 2 | 2 |
Monthly Return
| Return % | Jun | Jul | Aug | Sep | Oct | Nov | Dec | Jan | Feb | Mar | Apr | May |
|---|---|---|---|---|---|---|---|---|---|---|---|---|
| Fund | 0.67% | -0.03% | 2.61% | 1.28% | -2.16% | -0.71% | 0.33% | 3.90% | 2.62% | -5.90% | 6.79% | 0.36% |
| Benchmark | -0.66% | 0.44% | 3.85% | 2.37% | -0.49% | 2.55% | -3.40% | 2.15% | 7.41% | -5.81% | 5.83% | 0.79% |
Best Monthly Return Since Inception
11.29% (November 2020)
Worst Monthly Return Since Inception
-22.60% (March 2020)
Calendar Return (%)
| Return % | 2016 | 2017 | 2018 | 2019 | 2020 | 2021 | 2022 | 2023 | 2024 | 2025 |
|---|---|---|---|---|---|---|---|---|---|---|
| Fund | 15.20% | 10.13% | 2.59% | 19.90% | -5.81% | 33.05% | -22.12% | 3.08% | 0.66% | 10.58% |
| Benchmark | 1.59% | 1.40% | 2.74% | 15.42% | -11.04% | 30.68% | -19.44% | 10.39% | 10.11% | 4.74% |
| Category Average | 1.20% | 5.38% | 0.16% | 19.52% | -6.93% | 27.77% | -21.53% | 6.48% | 5.17% | 4.31% |
| Quartile Ranking | 1 | 1 | 1 | 3 | 2 | 1 | 3 | 4 | 4 | 1 |
| Category Rank | 6/ 96 | 8/ 98 | 25/ 102 | 62/ 110 | 52/ 120 | 31/ 126 | 65/ 126 | 125/ 137 | 138/ 142 | 12/ 144 |
Best Calendar Return (Last 10 years)
33.05% (2021)
Worst Calendar Return (Last 10 years)
-22.12% (2022)
Asset Allocation
| Name | Percent |
|---|---|
| Income Trust Units | 79.80 |
| Canadian Equity | 17.50 |
| US Equity | 2.05 |
| Cash and Equivalents | 0.64 |
| Other | 0.01 |
Sector Allocation
| Name | Percent |
|---|---|
| Real Estate | 89.27 |
| Healthcare | 9.07 |
| Cash and Cash Equivalent | 0.64 |
| Other | 1.02 |
Geographic Allocation
| Name | Percent |
|---|---|
| North America | 100.00 |
Top Holdings
| Name | Percent |
|---|---|
| RioCan REIT - Units | 7.44 |
| Granite REIT - Units | 7.17 |
| Dream Industrial REIT - Units | 7.07 |
| Killam Apartment REIT - Units Cl A | 6.06 |
| First Capital REIT - Units | 5.70 |
| Crombie REIT - Units | 5.43 |
| Chartwell Retirement Residences - Units | 5.28 |
| Primaris Real Estate Investment Trst Sr A | 5.14 |
| H&R REIT - Units | 4.81 |
| SmartCentres REIT - Units | 4.36 |
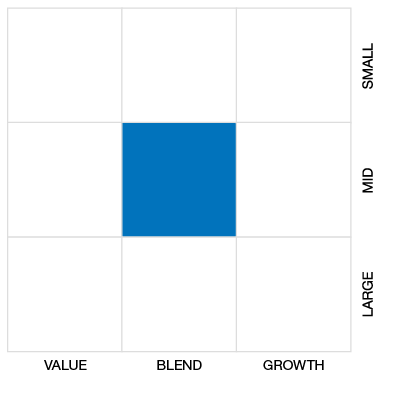
Equity Style
Fixed Income Style

Risk vs Return (3 Yr)
CI Canadian REIT Fund Series A
Median
Other - Real Estate Equity
3 Yr Annualized
| Standard Deviation | 14.79% | 16.51% | 15.19% |
|---|---|---|---|
| Beta | 0.88 | 0.94 | 0.92 |
| Alpha | -0.03 | -0.03 | 0.01 |
| Rsquared | 0.64% | 0.74% | 0.76% |
| Sharpe | 0.30 | 0.05 | 0.30 |
| Sortino | 0.51 | 0.07 | 0.31 |
| Treynor | 0.05 | 0.01 | 0.05 |
| Tax Efficiency | 78.76% | 43.35% | 71.68% |
| Volatility |

|
|
|
Risk Rating

Annualized Key Ratio Period Comparison
| Key Ratio | 1 Yr | 3 Yr | 5 Yr | 10 Yr |
|---|---|---|---|---|
| Standard Deviation | 10.93% | 14.79% | 16.51% | 15.19% |
| Beta | 0.68 | 0.88 | 0.94 | 0.92 |
| Alpha | 0.00 | -0.03 | -0.03 | 0.01 |
| Rsquared | 0.62% | 0.64% | 0.74% | 0.76% |
| Sharpe | 0.68 | 0.30 | 0.05 | 0.30 |
| Sortino | 1.01 | 0.51 | 0.07 | 0.31 |
| Treynor | 0.11 | 0.05 | 0.01 | 0.05 |
| Tax Efficiency | 85.48% | 78.76% | 43.35% | 71.68% |
Fund Details
| Start Date | June 07, 2010 |
|---|---|
| Instrument Type | Mutual Fund |
| Share Class | Commission Based Advice |
| Legal Status | Trust |
| Sales Status | Open |
| Currency | CAD |
| Distribution Frequency | Monthly |
| Assets ($mil) | $57 |
Fund Codes
| FundServ Code | Load Code | Sales Status |
|---|---|---|
| CIG95800 | ||
| CIG95801 | ||
| CIG95803 |
Investment Objectives
The Fund’s investment objective is to provide unitholders with quarterly distributions and the opportunity for capital appreciation through investment primarily in real estate investment trusts (“REITs”), equity securities of corporations carrying on business in the real estate sector and debt or convertible debt issued by REITs and real estate corporations.
Investment Strategy
The Fund has been created to invest in a portfolio comprised primarily of equity securities of REITs and common equities of corporations carrying on business in the real estate sector, but may also invest in the convertible debentures of such issuers.
Portfolio Management
| Portfolio Manager |
CI Global Asset Management
|
|---|---|
| Sub-Advisor |
- |
Management and Organization
| Fund Manager |
CI Global Asset Management |
|---|---|
| Custodian |
CIBC Mellon Trust Company |
| Registrar |
CI Global Asset Management |
| Distributor |
- |
Investment Minimums
| RSP Eligible | Yes |
|---|---|
| PAC Allowed | Yes |
| PAC Initial Investment | 25 |
| PAC Subsequent | 25 |
| SWP Allowed | No |
| SWP Min Balance | - |
| SWP Min Withdrawal | - |
Fees
| MER | 2.36% |
|---|---|
| Management Fee | 2.00% |
| Load | Choice of Front or No Load |
| FE Max | 5.00% |
| DSC Max | 5.50% |
| Trailer Fee Max (FE) | 1.00% |
| Trailer Fee Max (DSC) | 0.60% |
| Trailer Fee Max (NL) | - |
| Trailer Fee Max (LL) | - |
Try Fund Library Premium
Free with a 30 day trial!
Gain access to
- Unlimited Watchlists
- Advanced Search Filtering
- Fund Comparisons
- Portfolio Scenarios
- Customizable PDF Reports
- Portfolio Rebalancer new
