Try Fund Library Premium
For Free with a 30 day trial!
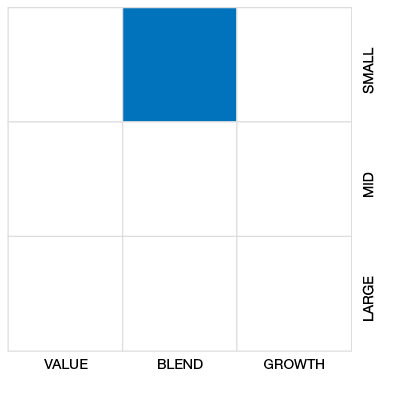
Cdn Small/Mid Cap Equity
 Click for more information on Fundata’s FundGrade
Click for more information on Fundata’s FundGrade.
|
NAVPS (12-12-2025) |
$47.56 |
|---|---|
| Change |
$0.19
(0.41%)
|
As at November 30, 2025
As at September 30, 2025
Inception Return (November 29, 2013): 13.62%
| Row Heading | Return | Annualized Return | ||||||||||||
|---|---|---|---|---|---|---|---|---|---|---|---|---|---|---|
| 1 Mth | 3 Mth | 6 Mth | YTD | 1 Yr | 2 Yr | 3 Yr | 4 Yr | 5 Yr | 6 Yr | 7 Yr | 8 Yr | 9 Yr | 10 Yr | |
| Fund | 1.11% | 5.79% | 17.66% | 24.95% | 24.12% | 26.96% | 21.41% | 16.82% | 19.85% | 21.00% | 18.73% | 14.13% | 13.77% | 15.93% |
| Benchmark | 5.23% | 17.24% | 38.15% | 46.68% | 41.85% | 34.48% | 21.49% | 13.80% | 16.09% | 15.47% | 14.07% | 10.28% | 9.57% | 11.56% |
| Category Average | 2.20% | 7.45% | 18.13% | 21.37% | 17.92% | 21.66% | 13.92% | 8.43% | 11.45% | 11.00% | 10.70% | 7.94% | 7.49% | 8.07% |
| Category Rank | 10 / 15 | 11 / 15 | 13 / 15 | 9 / 15 | 8 / 15 | 8 / 15 | 4 / 15 | 3 / 14 | 3 / 12 | 4 / 12 | 4 / 12 | 2 / 11 | 2 / 11 | 2 / 11 |
| Quartile Ranking | 3 | 3 | 4 | 3 | 3 | 3 | 2 | 1 | 1 | 2 | 2 | 1 | 1 | 1 |
| Return % | Dec | Jan | Feb | Mar | Apr | May | Jun | Jul | Aug | Sep | Oct | Nov |
|---|---|---|---|---|---|---|---|---|---|---|---|---|
| Fund | -0.66% | 2.31% | -1.22% | -0.52% | 0.96% | 4.63% | 4.46% | 1.63% | 4.77% | 5.49% | -0.82% | 1.11% |
| Benchmark | -3.30% | 0.65% | -2.27% | 2.56% | -1.83% | 7.20% | 6.19% | 1.50% | 9.34% | 8.91% | 2.30% | 5.23% |
17.58% (April 2020)
-26.76% (March 2020)
| Return % | 2015 | 2016 | 2017 | 2018 | 2019 | 2020 | 2021 | 2022 | 2023 | 2024 |
|---|---|---|---|---|---|---|---|---|---|---|
| Fund | 2.35% | 37.30% | 13.19% | -19.14% | 14.17% | 34.34% | 23.16% | 2.86% | 13.37% | 24.97% |
| Benchmark | -13.31% | 38.48% | 2.75% | -18.17% | 15.84% | 12.87% | 20.27% | -9.29% | 4.79% | 18.83% |
| Category Average | -6.13% | 18.01% | 3.43% | -15.15% | 16.59% | 11.91% | 22.35% | -11.32% | 6.49% | 16.84% |
| Quartile Ranking | 1 | 2 | 1 | 3 | 4 | 2 | 2 | 2 | 1 | 2 |
| Category Rank | 2/ 11 | 4/ 11 | 2/ 11 | 8/ 11 | 12/ 12 | 4/ 12 | 6/ 12 | 4/ 14 | 3/ 15 | 4/ 15 |
37.30% (2016)
-19.14% (2018)
| Name | Percent |
|---|---|
| Canadian Equity | 86.55 |
| US Equity | 6.99 |
| International Equity | 4.21 |
| Income Trust Units | 2.24 |
| Other | 0.01 |
| Name | Percent |
|---|---|
| Basic Materials | 29.13 |
| Consumer Goods | 12.79 |
| Energy | 11.81 |
| Consumer Services | 9.99 |
| Industrial Goods | 8.07 |
| Other | 28.21 |
| Name | Percent |
|---|---|
| North America | 95.78 |
| Latin America | 3.06 |
| Europe | 0.96 |
| Africa and Middle East | 0.20 |
| Name | Percent |
|---|---|
| Hillsdale US Micro Cap Equity Fund Series Z U$ | 5.55 |
| Thor Explorations Ltd | 4.49 |
| Groupe Dynamite Inc | 3.49 |
| Black Diamond Group Ltd | 2.63 |
| AutoCanada Inc | 2.56 |
| Total Energy Services Inc | 2.54 |
| Elemental Royalties Corp | 2.53 |
| Firan Technology Group Corp | 2.46 |
| Dexterra Group Inc | 2.18 |
| Forage Orbit Garant Inc | 2.17 |

Hillsdale Canadian Micro Cap Equity Fund Series A CA$
Median
Other - Cdn Small/Mid Cap Equity
| Standard Deviation | 9.76% | 12.73% | 16.34% |
|---|---|---|---|
| Beta | 0.47% | 0.63% | 0.71% |
| Alpha | 0.10% | 0.09% | 0.07% |
| Rsquared | 0.44% | 0.60% | 0.74% |
| Sharpe | 1.65% | 1.29% | 0.88% |
| Sortino | 3.67% | 1.97% | 1.17% |
| Treynor | 0.35% | 0.26% | 0.20% |
| Tax Efficiency | 100.00% | 100.00% | 100.00% |
| Volatility |

|

|

|

| Key Ratio | 1 Yr | 3 Yr | 5 Yr | 10 Yr |
|---|---|---|---|---|
| Standard Deviation | 8.51% | 9.76% | 12.73% | 16.34% |
| Beta | 0.47% | 0.47% | 0.63% | 0.71% |
| Alpha | 0.05% | 0.10% | 0.09% | 0.07% |
| Rsquared | 0.68% | 0.44% | 0.60% | 0.74% |
| Sharpe | 2.28% | 1.65% | 1.29% | 0.88% |
| Sortino | 8.79% | 3.67% | 1.97% | 1.17% |
| Treynor | 0.42% | 0.35% | 0.26% | 0.20% |
| Tax Efficiency | 100.00% | 100.00% | 100.00% | 100.00% |
| Start Date | November 29, 2013 |
|---|---|
| Instrument Type | Exempt Product |
| Share Class | Commission Based Advice |
| Legal Status | Trust |
| Sales Status | Open |
| Currency | CAD |
| Distribution Frequency | Annual |
| Assets ($mil) | $166 |
| FundServ Code | Load Code | Sales Status |
|---|---|---|
| HIL230 |
The investment objective of the fund is to provide investors with long term capital growth in excess of the S&P/TSX Small Cap Index over five years by investing primarily in Canadian equities of smaller capitalization companies.
The Fund invests a minimum of 75% of its assets in a diversified selection of small capitalization Canadian corporations and trusts trading on major Canadian stock exchanges with a market capitalization between $25 million and $250 million at the time of investment. The Fund will have no fewer than 20 holdings encompassing no less than five sectors.
| Portfolio Manager |
Hillsdale Investment Management Inc.
|
|---|---|
| Sub-Advisor |
- |
| Fund Manager |
Hillsdale Investment Management Inc. |
|---|---|
| Custodian |
- |
| Registrar |
- |
| Distributor |
- |
| RSP Eligible | Yes |
|---|---|
| PAC Allowed | No |
| PAC Initial Investment | - |
| PAC Subsequent | - |
| SWP Allowed | No |
| SWP Min Balance | - |
| SWP Min Withdrawal | - |
| MER | - |
|---|---|
| Management Fee | 2.50% |
| Load | No Load |
| FE Max | - |
| DSC Max | - |
| Trailer Fee Max (FE) | - |
| Trailer Fee Max (DSC) | - |
| Trailer Fee Max (NL) | - |
| Trailer Fee Max (LL) | - |
Try Fund Library Premium
For Free with a 30 day trial!
 Fund Library