Join Fund Library now and get free access to personalized features to help you manage your investments.
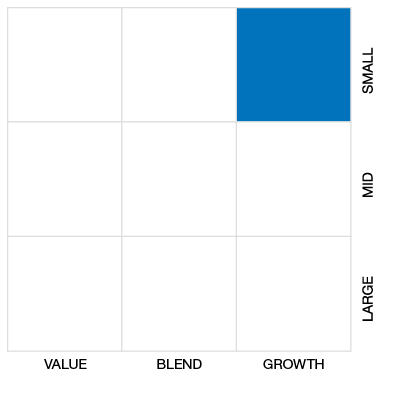
Cdn Small/Mid Cap Equity
 Click for more information on Fundata’s FundGrade
Click for more information on Fundata’s FundGrade.
 Click for more information on Fundata’s ESG Grade
Click for more information on Fundata’s ESG Grade.
|
NAVPS (05-17-2024) |
$25.43 |
|---|---|
| Change |
-$0.06
(-0.23%)
|
As at April 30, 2024
As at March 31, 2024
As at February 29, 2024
Inception Return (July 04, 2008): 7.41%
| Row Heading | Return | Annualized Return | ||||||||||||
|---|---|---|---|---|---|---|---|---|---|---|---|---|---|---|
| 1 Mth | 3 Mth | 6 Mth | YTD | 1 Yr | 2 Yr | 3 Yr | 4 Yr | 5 Yr | 6 Yr | 7 Yr | 8 Yr | 9 Yr | 10 Yr | |
| Fund | -1.82% | 0.34% | 13.13% | 2.05% | 10.12% | 7.31% | 6.27% | 15.12% | 8.10% | 6.88% | 5.78% | 6.24% | 5.56% | 4.95% |
| Benchmark | 0.17% | 8.50% | 17.60% | 8.10% | 9.69% | 0.65% | 2.64% | 15.86% | 7.92% | 5.32% | 4.57% | 5.57% | 5.07% | 3.57% |
| Category Average | -1.98% | 16.13% | 16.13% | 4.41% | 8.17% | 3.47% | 2.22% | 12.84% | 6.98% | 5.40% | 4.74% | 5.51% | 4.28% | 3.85% |
| Category Rank | 62 / 212 | 192 / 209 | 191 / 209 | 198 / 209 | 71 / 208 | 50 / 206 | 45 / 197 | 60 / 188 | 91 / 182 | 81 / 172 | 85 / 163 | 85 / 160 | 71 / 136 | 74 / 131 |
| Quartile Ranking | 2 | 4 | 4 | 4 | 2 | 1 | 1 | 2 | 2 | 2 | 3 | 3 | 3 | 3 |
| Return % | May | Jun | Jul | Aug | Sep | Oct | Nov | Dec | Jan | Feb | Mar | Apr |
|---|---|---|---|---|---|---|---|---|---|---|---|---|
| Fund | -0.35% | 1.23% | 2.40% | -2.52% | -2.02% | -1.34% | 5.53% | 5.04% | 1.70% | 0.82% | 1.38% | -1.82% |
| Benchmark | -4.06% | 0.59% | 6.09% | -1.31% | -5.24% | -2.58% | 4.84% | 3.76% | -0.37% | 0.77% | 7.49% | 0.17% |
14.11% (April 2020)
-25.70% (March 2020)
| Return % | 2014 | 2015 | 2016 | 2017 | 2018 | 2019 | 2020 | 2021 | 2022 | 2023 |
|---|---|---|---|---|---|---|---|---|---|---|
| Fund | 5.71% | -6.82% | 21.95% | 1.80% | -12.29% | 15.14% | 0.23% | 23.99% | 0.80% | 10.43% |
| Benchmark | -2.34% | -13.31% | 38.48% | 2.75% | -18.17% | 15.84% | 12.87% | 20.27% | -9.29% | 4.79% |
| Category Average | 3.45% | -6.13% | 18.01% | 3.43% | -15.15% | 16.59% | 11.91% | 22.35% | -11.32% | 6.49% |
| Quartile Ranking | 3 | 3 | 2 | 3 | 2 | 4 | 4 | 2 | 1 | 2 |
| Category Rank | 74/ 130 | 100/ 135 | 52/ 157 | 104/ 162 | 52/ 172 | 153/ 179 | 172/ 184 | 87/ 196 | 18/ 205 | 59/ 208 |
23.99% (2021)
-12.29% (2018)
| Name | Percent |
|---|---|
| Canadian Equity | 93.98 |
| Cash and Equivalents | 2.47 |
| Income Trust Units | 2.33 |
| US Equity | 1.22 |
| Name | Percent |
|---|---|
| Energy | 17.54 |
| Financial Services | 17.08 |
| Basic Materials | 12.05 |
| Industrial Services | 11.01 |
| Consumer Services | 9.45 |
| Other | 32.87 |
| Name | Percent |
|---|---|
| North America | 100.00 |
| Name | Percent |
|---|---|
| Winpak Ltd | 4.49 |
| AltaGas Ltd | 4.40 |
| Canadian Western Bank | 4.32 |
| Parkland Fuel Corp | 4.11 |
| Mullen Group Ltd | 3.85 |
| Stella-Jones Inc | 3.75 |
| Information Services Corp Cl A | 3.75 |
| Secure Energy Services Inc | 3.68 |
| E-L Financial Corp Ltd | 3.52 |
| iA Financial Corp Inc | 3.48 |

IA Clarington Canadian Small Cap Class Series A
Median
Other - Cdn Small/Mid Cap Equity
| Standard Deviation | 10.42% | 17.55% | 13.83% |
|---|---|---|---|
| Beta | 0.51% | 0.64% | 0.59% |
| Alpha | 0.05% | 0.03% | 0.03% |
| Rsquared | 0.65% | 0.82% | 0.74% |
| Sharpe | 0.37% | 0.43% | 0.32% |
| Sortino | 0.53% | 0.49% | 0.27% |
| Treynor | 0.08% | 0.12% | 0.08% |
| Tax Efficiency | 83.55% | 83.12% | 80.85% |
| Volatility |

|

|

|

| Key Ratio | 1 Yr | 3 Yr | 5 Yr | 10 Yr |
|---|---|---|---|---|
| Standard Deviation | 9.11% | 10.42% | 17.55% | 13.83% |
| Beta | 0.46% | 0.51% | 0.64% | 0.59% |
| Alpha | 0.05% | 0.05% | 0.03% | 0.03% |
| Rsquared | 0.50% | 0.65% | 0.82% | 0.74% |
| Sharpe | 0.58% | 0.37% | 0.43% | 0.32% |
| Sortino | 1.58% | 0.53% | 0.49% | 0.27% |
| Treynor | 0.11% | 0.08% | 0.12% | 0.08% |
| Tax Efficiency | 92.15% | 83.55% | 83.12% | 80.85% |
The E, S, and G scores are averaged for each security in the portfolio, to arrive at an ESG score for each security. We take the portfolio weighted average of the ESG scores for each fund and rank them against their peers to arrive at the Fundata ESG Score from 0-100.
Three scores under the Environment bucket are averaged to yield the Fundata Environment Score for each fund from 0-100: (1) Pollution Prevention, (2) Environmental Transparency, (3) Resource Efficiency.
Six scores under the Social bucket are averaged to yield the Fundata Social Score for each fund from 0-100. (1) Compensation and Satisfaction, (2) Diversity and Rights, (3) Education and Work Conditions, (4) Community and Charity, (5) Human Rights, (6) Sustainability Integration.
Three scores under the governance bucket are averaged to yield the Fundata Governance Score for each fund from 0-100: (1) Board Effectiveness, (2) Management Ethics, (3) Disclosure and Accountability.
Powered by OWL Analytics. For more information, please contact Fundata Canada.
| Start Date | July 04, 2008 |
|---|---|
| Instrument Type | Mutual Fund |
| Share Class | Commission Based Advice |
| Legal Status | Corporation |
| Sales Status | Open |
| Currency | CAD |
| Distribution Frequency | Annual |
| Assets ($mil) | $59 |
| FundServ Code | Load Code | Sales Status |
|---|---|---|
| CCM8078 | ||
| CCM8088 | ||
| CCM8089 |
The Fund’s objective is to maximize long-term growth of capital by investing primarily in equity securities of small capitalization Canadian companies. It may invest in those securities either directly or by investing in securities of another mutual fund that invests in those securities.
The Fund invests substantially all of its assets in units of IA Clarington Canadian Small Cap Fund, which we refer to as the “ Reference Fund”. The Fund: will hold cash or cash equivalents only while the investment in units of the Reference Fund is pending or in order to facilitate redemptions.
| Name | Start Date |
|---|---|
| Leigh Pullen | 03-20-1997 |
| Joe Jugovic | 05-19-2005 |
| Industrial Alliance Investment Management Inc. | 07-19-2007 |
| Ian Cooke | 02-28-2010 |
| Fund Manager | IA Clarington Investments Inc. |
|---|---|
| Advisor | Industrial Alliance Investment Management Inc. |
| Custodian | CIBC Mellon Trust Company |
| Registrar | IA Clarington Investments Inc. |
| Distributor | - |
| Auditor | PriceWaterhouseCoopers LLP |
| RSP Eligible | Yes |
|---|---|
| PAC Allowed | Yes |
| PAC Initial Investment | 500 |
| PAC Subsequent | 50 |
| SWP Allowed | Yes |
| SWP Min Balance | 500 |
| SWP Min Withdrawal | 100 |
| MER | 2.59% |
|---|---|
| Management Fee | 2.10% |
| Load | Choice of Front or No Load |
| FE Max | 5.00% |
| DSC Max | 5.75% |
| Trailer Fee Max (FE) | 1.00% |
| Trailer Fee Max (DSC) | 0.50% |
| Trailer Fee Max (NL) | - |
| Trailer Fee Max (LL) | - |
Join Fund Library now and get free access to personalized features to help you manage your investments.
 Fund Library