Try Fund Library Premium
Free with a 30 day trial!
Gain access to
- Unlimited Watchlists
- Advanced Search Filtering
- Fund Comparisons
- Portfolio Scenarios
- Customizable PDF Reports
- Portfolio Rebalancer new
Arrow Opportunities Alternative Fund Series A
Alternative Equity Focus
 Click for more information on Fundata’s FundGrade
FundGrade B
Click for more information on Fundata’s FundGrade.
|
NAVPS (06-24-2026) |
$17.92 |
|---|---|
| Change |
-$0.11
(-0.63%)
|
As at May 31, 2026
As at April 30, 2026
Legend
Compare Options
Fund Returns
Inception Return (June 30, 2020): 21.45%
| Row Heading | Return | Annualized Return | ||||||||||||
|---|---|---|---|---|---|---|---|---|---|---|---|---|---|---|
| 1 Mth | 3 Mth | 6 Mth | YTD | 1 Yr | 2 Yr | 3 Yr | 4 Yr | 5 Yr | 6 Yr | 7 Yr | 8 Yr | 9 Yr | 10 Yr | |
| Fund | 0.84% | 3.25% | 16.76% | 15.49% | 36.04% | 22.67% | 17.60% | 11.66% | 10.91% | - | - | - | - | - |
| Benchmark | 2.52% | 1.83% | 12.07% | 10.61% | 36.06% | 28.34% | 24.64% | 17.23% | 15.30% | 18.20% | 15.06% | 13.48% | 12.83% | 12.77% |
| Category Average | 2.82% | 4.37% | 9.17% | 9.21% | 23.49% | 15.75% | 16.26% | 11.26% | 9.16% | 11.53% | 9.52% | - | - | - |
| Category Rank | 165 / 258 | 120 / 255 | 43 / 243 | 54 / 245 | 60 / 218 | 36 / 167 | 40 / 126 | 53 / 117 | 28 / 88 | - | - | - | - | - |
| Quartile Ranking | 3 | 2 | 1 | 1 | 2 | 1 | 2 | 2 | 2 | - | - | - | - | - |
Monthly Return
| Return % | Jun | Jul | Aug | Sep | Oct | Nov | Dec | Jan | Feb | Mar | Apr | May |
|---|---|---|---|---|---|---|---|---|---|---|---|---|
| Fund | 2.55% | -0.64% | 3.41% | 6.15% | 3.16% | 0.98% | 1.10% | 7.44% | 4.11% | -0.73% | 3.14% | 0.84% |
| Benchmark | 2.91% | 1.69% | 4.96% | 5.40% | 0.97% | 3.86% | 1.32% | 0.84% | 7.72% | -4.32% | 3.81% | 2.52% |
Best Monthly Return Since Inception
15.52% (December 2020)
Worst Monthly Return Since Inception
-4.88% (June 2022)
Calendar Return (%)
| Return % | 2016 | 2017 | 2018 | 2019 | 2020 | 2021 | 2022 | 2023 | 2024 | 2025 |
|---|---|---|---|---|---|---|---|---|---|---|
| Fund | - | - | - | - | - | 30.53% | 2.29% | 0.52% | 17.41% | 16.55% |
| Benchmark | 21.08% | 9.10% | -8.89% | 22.88% | 5.60% | 25.09% | -5.84% | 11.75% | 21.65% | 31.68% |
| Category Average | - | - | - | - | 5.11% | 17.27% | -5.96% | 6.54% | 16.58% | 15.40% |
| Quartile Ranking | - | - | - | - | - | 1 | 1 | 4 | 3 | 2 |
| Category Rank | - | - | - | - | - | 7/ 81 | 14/ 105 | 103/ 121 | 76/ 142 | 55/ 194 |
Best Calendar Return (Last 10 years)
30.53% (2021)
Worst Calendar Return (Last 10 years)
0.52% (2023)
Asset Allocation
| Name | Percent |
|---|---|
| Canadian Equity | 34.79 |
| Cash and Equivalents | 31.38 |
| US Equity | 25.92 |
| Income Trust Units | 8.98 |
| Canadian Corporate Bonds | 0.75 |
| Other | -1.82 |
Sector Allocation
| Name | Percent |
|---|---|
| Cash and Cash Equivalent | 31.37 |
| Energy | 13.76 |
| Basic Materials | 8.06 |
| Financial Services | 7.45 |
| Consumer Services | 4.92 |
| Other | 34.44 |
Geographic Allocation
| Name | Percent |
|---|---|
| North America | 100.98 |
| Asia | 0.57 |
| Latin America | 0.18 |
| Africa and Middle East | -0.06 |
| Europe | -0.08 |
| Other | -1.59 |
Top Holdings
| Name | Percent |
|---|---|
| Cash and Cash Equivalents | 20.59 |
| US DOLLAR | 10.12 |
| Enerflex Ltd | 4.09 |
| Madison Square Garden Sports Corp Cl A | 3.53 |
| EZCORP Inc Cl A | 3.35 |
| Stingray Group Inc | 2.66 |
| Brookfield Business Corp Cl A | 1.92 |
| Prairiesky Royalty Ltd | 1.84 |
| K-Bro Linen Inc | 1.59 |
| Boralex Inc Cl A | 1.58 |
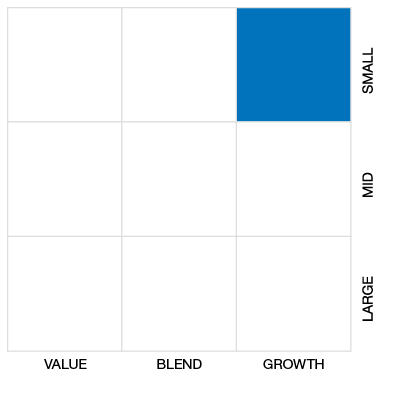
Equity Style
Fixed Income Style

Risk vs Return (3 Yr)
Arrow Opportunities Alternative Fund Series A
Median
Other - Alternative Equity Focus
3 Yr Annualized
| Standard Deviation | 8.24% | 8.54% | - |
|---|---|---|---|
| Beta | 0.36 | 0.26 | - |
| Alpha | 0.09 | 0.07 | - |
| Rsquared | 0.22% | 0.14% | - |
| Sharpe | 1.59 | 0.92 | - |
| Sortino | 4.59 | 1.78 | - |
| Treynor | 0.37 | 0.30 | - |
| Tax Efficiency | 94.69% | - | - |
| Volatility |

|
|
- |
Risk Rating

Annualized Key Ratio Period Comparison
| Key Ratio | 1 Yr | 3 Yr | 5 Yr | 10 Yr |
|---|---|---|---|---|
| Standard Deviation | 8.68% | 8.24% | 8.54% | - |
| Beta | 0.37 | 0.36 | 0.26 | - |
| Alpha | 0.20 | 0.09 | 0.07 | - |
| Rsquared | 0.20% | 0.22% | 0.14% | - |
| Sharpe | 3.36 | 1.59 | 0.92 | - |
| Sortino | 21.53 | 4.59 | 1.78 | - |
| Treynor | 0.78 | 0.37 | 0.30 | - |
| Tax Efficiency | 100.00% | 94.69% | - | - |
Fund Details
| Start Date | June 30, 2020 |
|---|---|
| Instrument Type | Mutual Fund (Alternative) |
| Share Class | Commission Based Advice |
| Legal Status | Trust |
| Sales Status | Open |
| Currency | CAD |
| Distribution Frequency | Annual |
| Assets ($mil) | $37 |
Fund Codes
| FundServ Code | Load Code | Sales Status |
|---|---|---|
| AHP5700 |
Investment Objectives
The investment objective of the Arrow Opportunities Alternative Fund is to achieve superior capital appreciation over both short- and long-term horizons primarily through the selection and management of long and short positions in global equity securities and equity derivative securities. The fund will use leverage. The leverage will be created through the use of cash borrowings, short sales and derivative contracts.
Investment Strategy
The Fund will invest predominantly in global companies of all market capitalizations with a particular focus on North America. The Fund may also invest in bonds, other debt instruments, commodities and currencies if warranted by financial conditions. The Fund will not specialize in any one industry other than to concentrate investments in those industries that offer the best opportunities for exceptional returns at each stage of the economic and market cycle.
Portfolio Management
| Portfolio Manager |
Arrow Capital Management Inc.
|
|---|---|
| Sub-Advisor |
- |
Management and Organization
| Fund Manager |
Arrow Capital Management Inc. |
|---|---|
| Custodian |
CIBC World Markets Inc |
| Registrar |
RBC Investor Services Trust (Canada) |
| Distributor |
- |
Investment Minimums
| RSP Eligible | Yes |
|---|---|
| PAC Allowed | Yes |
| PAC Initial Investment | - |
| PAC Subsequent | - |
| SWP Allowed | Yes |
| SWP Min Balance | - |
| SWP Min Withdrawal | - |
Fees
| MER | 2.58% |
|---|---|
| Management Fee | 1.95% |
| Load | Back Fee Only |
| FE Max | 5.00% |
| DSC Max | - |
| Trailer Fee Max (FE) | 1.00% |
| Trailer Fee Max (DSC) | - |
| Trailer Fee Max (NL) | - |
| Trailer Fee Max (LL) | - |
Try Fund Library Premium
Free with a 30 day trial!
Gain access to
- Unlimited Watchlists
- Advanced Search Filtering
- Fund Comparisons
- Portfolio Scenarios
- Customizable PDF Reports
- Portfolio Rebalancer new
