Try Fund Library Premium
For Free with a 30 day trial!
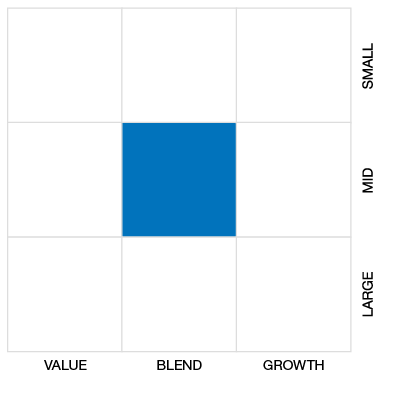
Global Small/Mid Cap Eq
 Click for more information on Fundata’s FundGrade
Click for more information on Fundata’s FundGrade.
 Click for more information on Fundata’s ESG Grade
Click for more information on Fundata’s ESG Grade.
|
NAVPS (03-11-2026) |
$13.37 |
|---|---|
| Change |
$0.00
(-0.03%)
|
As at February 28, 2026
As at December 31, 2025
As at February 28, 2026
Inception Return (November 12, 2018): 8.20%
| Row Heading | Return | Annualized Return | ||||||||||||
|---|---|---|---|---|---|---|---|---|---|---|---|---|---|---|
| 1 Mth | 3 Mth | 6 Mth | YTD | 1 Yr | 2 Yr | 3 Yr | 4 Yr | 5 Yr | 6 Yr | 7 Yr | 8 Yr | 9 Yr | 10 Yr | |
| Fund | 5.79% | 11.43% | 15.28% | 11.15% | 27.37% | 17.50% | 13.58% | 9.88% | 6.48% | 9.45% | 8.46% | - | - | - |
| Benchmark | 4.82% | 7.89% | 12.56% | 8.82% | 20.95% | 18.11% | 15.72% | 11.59% | 9.64% | 12.40% | 10.50% | 9.15% | 9.56% | 10.86% |
| Category Average | 3.03% | 5.96% | 8.69% | 6.40% | 18.53% | 13.96% | 12.29% | 8.41% | 6.54% | 10.12% | 8.09% | 6.55% | 6.91% | 7.78% |
| Category Rank | 42 / 289 | 42 / 288 | 50 / 279 | 40 / 289 | 54 / 273 | 52 / 260 | 96 / 246 | 104 / 228 | 99 / 208 | 114 / 190 | 98 / 168 | - | - | - |
| Quartile Ranking | 1 | 1 | 1 | 1 | 1 | 1 | 2 | 2 | 2 | 3 | 3 | - | - | - |
| Return % | Mar | Apr | May | Jun | Jul | Aug | Sep | Oct | Nov | Dec | Jan | Feb |
|---|---|---|---|---|---|---|---|---|---|---|---|---|
| Fund | -0.67% | 2.28% | 3.54% | 3.32% | -0.69% | 2.37% | 2.85% | -1.59% | 2.22% | 0.25% | 5.07% | 5.79% |
| Benchmark | -4.14% | -3.02% | 5.68% | 3.76% | 2.68% | 2.65% | 2.67% | 0.79% | 0.81% | -0.85% | 3.81% | 4.82% |
11.99% (November 2022)
-12.35% (March 2020)
| Return % | 2016 | 2017 | 2018 | 2019 | 2020 | 2021 | 2022 | 2023 | 2024 | 2025 |
|---|---|---|---|---|---|---|---|---|---|---|
| Fund | - | - | - | 17.64% | 10.34% | 10.12% | -15.47% | 8.95% | 5.75% | 19.24% |
| Benchmark | 7.47% | 15.40% | -7.34% | 20.09% | 11.07% | 15.50% | -13.14% | 14.59% | 18.68% | 11.95% |
| Category Average | 3.48% | 12.62% | -10.42% | 13.76% | 14.53% | 12.37% | -15.59% | 12.82% | 12.04% | 12.29% |
| Quartile Ranking | - | - | - | 2 | 3 | 4 | 2 | 4 | 3 | 1 |
| Category Rank | - | - | - | 74/ 166 | 109/ 171 | 170/ 206 | 109/ 228 | 182/ 239 | 184/ 257 | 53/ 270 |
19.24% (2025)
-15.47% (2022)
| Name | Percent |
|---|---|
| International Equity | 97.81 |
| Income Trust Units | 1.55 |
| Cash and Equivalents | 0.64 |
| Name | Percent |
|---|---|
| Industrial Goods | 14.26 |
| Real Estate | 13.71 |
| Financial Services | 13.43 |
| Basic Materials | 13.34 |
| Consumer Goods | 12.63 |
| Other | 32.63 |
| Name | Percent |
|---|---|
| Asia | 49.89 |
| Europe | 48.16 |
| Africa and Middle East | 0.99 |
| Latin America | 0.89 |
| North America | 0.08 |
| Name | Percent |
|---|---|
| BAWAG Group AG | 2.34 |
| Sandfire Resources Ltd | 2.20 |
| Open House Co Ltd | 2.17 |
| Coca-Cola Bottlers Japan Holdings Inc | 2.16 |
| BPER Banca SpA | 2.13 |
| Canon Marketing Japan Inc | 1.96 |
| Glenveagh Properties PLC | 1.88 |
| Fuyo General Lease Co Ltd | 1.81 |
| Weir Group PLC | 1.81 |
| Orica Ltd | 1.80 |

IG Mackenzie International Small Cap Fund Series F
Median
Other - Global Small/Mid Cap Eq
| Standard Deviation | 10.80% | 13.20% | - |
|---|---|---|---|
| Beta | 0.65% | 0.80% | - |
| Alpha | 0.03% | -0.01% | - |
| Rsquared | 0.54% | 0.65% | - |
| Sharpe | 0.89% | 0.33% | - |
| Sortino | 1.84% | 0.49% | - |
| Treynor | 0.15% | 0.05% | - |
| Tax Efficiency | 86.33% | 76.83% | - |
| Volatility |

|

|
- |

| Key Ratio | 1 Yr | 3 Yr | 5 Yr | 10 Yr |
|---|---|---|---|---|
| Standard Deviation | 8.03% | 10.80% | 13.20% | - |
| Beta | 0.47% | 0.65% | 0.80% | - |
| Alpha | 0.16% | 0.03% | -0.01% | - |
| Rsquared | 0.38% | 0.54% | 0.65% | - |
| Sharpe | 2.77% | 0.89% | 0.33% | - |
| Sortino | 9.59% | 1.84% | 0.49% | - |
| Treynor | 0.48% | 0.15% | 0.05% | - |
| Tax Efficiency | 90.18% | 86.33% | 76.83% | - |
The E, S, and G scores are averaged for each security in the portfolio, to arrive at an ESG score for each security. We take the portfolio weighted average of the ESG scores for each fund and rank them against their peers to arrive at the Fundata ESG Score from 0-100.
Three scores under the Environment bucket are averaged to yield the Fundata Environment Score for each fund from 0-100: (1) Pollution Prevention, (2) Environmental Transparency, (3) Resource Efficiency.
Six scores under the Social bucket are averaged to yield the Fundata Social Score for each fund from 0-100. (1) Compensation and Satisfaction, (2) Diversity and Rights, (3) Education and Work Conditions, (4) Community and Charity, (5) Human Rights, (6) Sustainability Integration.
Three scores under the governance bucket are averaged to yield the Fundata Governance Score for each fund from 0-100: (1) Board Effectiveness, (2) Management Ethics, (3) Disclosure and Accountability.
Powered by OWL Analytics. For more information, please contact Fundata Canada.
| Start Date | November 12, 2018 |
|---|---|
| Instrument Type | Mutual Fund |
| Share Class | Fee Based Advice |
| Legal Status | Trust |
| Sales Status | Open |
| Currency | CAD |
| Distribution Frequency | Annual |
| Assets ($mil) | $953 |
| FundServ Code | Load Code | Sales Status |
|---|---|---|
| IGI1820 |
The Fund aims to provide long-term capital growth by investing primarily in the common shares of smallcapitalization corporations outside of Canada and the U.S. In order to change its fundamental investment objective, the Fund needs approval from a majority of its investors who vote at a meeting held for this purpose, unless it is required by law to make the change.
The Fund intends to: invest primarily in small corporations diversified geographically and by industry in all markets, excluding Canada and the U.S.; invest in corporations which possess innovative and cost-effective products and services which are well positioned for substantial growth; and favour corporations that are attractively valued with a competitive advantage (market share, global scale, low cost) and strong, experienced management/ownership teams.
| Portfolio Manager |
Mackenzie Investments Europe Limited
|
|---|---|
| Sub-Advisor |
- |
| Fund Manager |
I.G. Investment Management, Ltd. |
|---|---|
| Custodian |
Canadian Imperial Bank of Commerce |
| Registrar |
I.G. Investment Management, Ltd. |
| Distributor |
Investors Group Financial Services Inc. Investors Group Securities Inc. |
| RSP Eligible | Yes |
|---|---|
| PAC Allowed | Yes |
| PAC Initial Investment | 50 |
| PAC Subsequent | 50 |
| SWP Allowed | Yes |
| SWP Min Balance | 10,000 |
| SWP Min Withdrawal | 100 |
| MER | 1.09% |
|---|---|
| Management Fee | 0.75% |
| Load | No Load |
| FE Max | - |
| DSC Max | - |
| Trailer Fee Max (FE) | - |
| Trailer Fee Max (DSC) | - |
| Trailer Fee Max (NL) | - |
| Trailer Fee Max (LL) | - |
Try Fund Library Premium
For Free with a 30 day trial!
 Fund Library