Try Fund Library Premium
Free with a 30 day trial!
Gain access to
- Unlimited Watchlists
- Advanced Search Filtering
- Fund Comparisons
- Portfolio Scenarios
- Customizable PDF Reports
- Portfolio Rebalancer new
BMO Canadian Small Cap Equity Fund Series A
Cdn Small/Mid Cap Equity
 Click for more information on Fundata’s FundGrade
FundGrade D
Click for more information on Fundata’s FundGrade.
|
NAVPS (06-24-2026) |
$57.99 |
|---|---|
| Change |
-$0.99
(-1.69%)
|
As at May 31, 2026
As at February 28, 2026
Legend
Compare Options
Fund Returns
Inception Return (August 03, 1993): 8.38%
| Row Heading | Return | Annualized Return | ||||||||||||
|---|---|---|---|---|---|---|---|---|---|---|---|---|---|---|
| 1 Mth | 3 Mth | 6 Mth | YTD | 1 Yr | 2 Yr | 3 Yr | 4 Yr | 5 Yr | 6 Yr | 7 Yr | 8 Yr | 9 Yr | 10 Yr | |
| Fund | 0.15% | -8.74% | 16.16% | 7.16% | 37.08% | 24.41% | 16.86% | 10.63% | 6.58% | 11.58% | 10.56% | 8.72% | 7.56% | 8.10% |
| Benchmark | 3.36% | 0.40% | 25.77% | 22.83% | 73.76% | 40.55% | 32.35% | 20.41% | 16.03% | 23.14% | 17.52% | 13.32% | 12.51% | 12.12% |
| Category Average | 2.79% | -1.67% | 13.67% | 10.77% | 34.27% | 23.87% | 19.47% | 13.35% | 10.39% | 15.76% | 12.06% | 9.62% | 8.86% | 8.78% |
| Category Rank | 179 / 196 | 194 / 195 | 60 / 193 | 144 / 194 | 86 / 192 | 99 / 191 | 122 / 187 | 146 / 184 | 158 / 177 | 152 / 169 | 121 / 167 | 113 / 159 | 125 / 157 | 107 / 147 |
| Quartile Ranking | 4 | 4 | 2 | 3 | 2 | 3 | 3 | 4 | 4 | 4 | 3 | 3 | 4 | 3 |
Monthly Return
| Return % | Jun | Jul | Aug | Sep | Oct | Nov | Dec | Jan | Feb | Mar | Apr | May |
|---|---|---|---|---|---|---|---|---|---|---|---|---|
| Fund | 5.27% | 0.55% | 4.28% | 5.96% | 1.79% | -0.86% | 8.40% | 6.44% | 10.31% | -12.29% | 3.89% | 0.15% |
| Benchmark | 6.19% | 1.50% | 9.34% | 8.91% | 2.30% | 5.23% | 2.39% | 8.69% | 12.56% | -8.97% | 6.71% | 3.36% |
Best Monthly Return Since Inception
22.22% (February 2000)
Worst Monthly Return Since Inception
-22.94% (March 2020)
Calendar Return (%)
| Return % | 2016 | 2017 | 2018 | 2019 | 2020 | 2021 | 2022 | 2023 | 2024 | 2025 |
|---|---|---|---|---|---|---|---|---|---|---|
| Fund | 9.48% | 5.18% | -17.05% | 26.18% | 23.09% | 22.61% | -20.90% | -3.98% | 13.49% | 30.97% |
| Benchmark | 38.48% | 2.75% | -18.17% | 15.84% | 12.87% | 20.27% | -9.29% | 4.79% | 18.83% | 50.19% |
| Category Average | 18.01% | 3.43% | -15.15% | 16.59% | 11.91% | 22.35% | -11.32% | 6.49% | 16.84% | 24.55% |
| Quartile Ranking | 4 | 2 | 3 | 1 | 1 | 2 | 4 | 4 | 4 | 2 |
| Category Rank | 120/ 144 | 53/ 149 | 110/ 158 | 32/ 165 | 20/ 169 | 88/ 176 | 168/ 184 | 186/ 187 | 165/ 188 | 69/ 191 |
Best Calendar Return (Last 10 years)
30.97% (2025)
Worst Calendar Return (Last 10 years)
-20.90% (2022)
Asset Allocation
| Name | Percent |
|---|---|
| Canadian Equity | 93.55 |
| Cash and Equivalents | 3.52 |
| Income Trust Units | 2.92 |
| Other | 0.01 |
Sector Allocation
| Name | Percent |
|---|---|
| Basic Materials | 26.63 |
| Energy | 19.57 |
| Financial Services | 8.99 |
| Consumer Services | 7.92 |
| Industrial Services | 6.31 |
| Other | 30.58 |
Geographic Allocation
| Name | Percent |
|---|---|
| North America | 100.00 |
Top Holdings
| Name | Percent |
|---|---|
| GOLD X2 MINING INC | 5.64 |
| GOLDSKY RESOURCES CORP | 5.29 |
| North American Construction Group Ltd | 5.00 |
| Zedcor Inc | 4.87 |
| NG Energy International Corp | 4.76 |
| Trisura Group Ltd | 4.36 |
| K92 Mining Inc | 3.66 |
| G Mining Ventures Corp | 3.57 |
| Fuerte Metals Corp | 3.56 |
| Southern Cross Gold Consolidated Ltd | 3.31 |
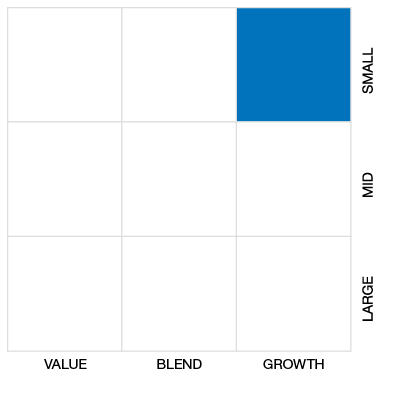
Equity Style
Fixed Income Style

Risk vs Return (3 Yr)
BMO Canadian Small Cap Equity Fund Series A
Median
Other - Cdn Small/Mid Cap Equity
3 Yr Annualized
| Standard Deviation | 15.36% | 15.83% | 16.63% |
|---|---|---|---|
| Beta | 0.80 | 0.73 | 0.69 |
| Alpha | -0.07 | -0.04 | 0.00 |
| Rsquared | 0.66% | 0.62% | 0.70% |
| Sharpe | 0.86 | 0.30 | 0.44 |
| Sortino | 1.47 | 0.43 | 0.54 |
| Treynor | 0.17 | 0.06 | 0.11 |
| Tax Efficiency | 86.26% | 75.40% | 87.10% |
| Volatility |

|
|

|
Risk Rating

Annualized Key Ratio Period Comparison
| Key Ratio | 1 Yr | 3 Yr | 5 Yr | 10 Yr |
|---|---|---|---|---|
| Standard Deviation | 20.22% | 15.36% | 15.83% | 16.63% |
| Beta | 0.91 | 0.80 | 0.73 | 0.69 |
| Alpha | -0.19 | -0.07 | -0.04 | 0.00 |
| Rsquared | 0.74% | 0.66% | 0.62% | 0.70% |
| Sharpe | 1.56 | 0.86 | 0.30 | 0.44 |
| Sortino | 2.45 | 1.47 | 0.43 | 0.54 |
| Treynor | 0.35 | 0.17 | 0.06 | 0.11 |
| Tax Efficiency | 88.64% | 86.26% | 75.40% | 87.10% |
Fund Details
| Start Date | August 03, 1993 |
|---|---|
| Instrument Type | Mutual Fund |
| Share Class | Commission Based Advice |
| Legal Status | Trust |
| Sales Status | Open |
| Currency | CAD |
| Distribution Frequency | Annual |
| Assets ($mil) | $219 |
Fund Codes
| FundServ Code | Load Code | Sales Status |
|---|---|---|
| BMO136 | ||
| BMO70136 |
Investment Objectives
This fund’s objective is to provide above-average growth in the value of your investment over the long term by investing in small and mid-sized Canadian companies. The fundamental investment objectives may only be changed with the approval of a majority of the votes cast at a meeting of unitholders called for that purpose.
Investment Strategy
These are the strategies the portfolio manager uses to try to achieve the fund’s objective: invests in equities of Canadian small and mid-sized companies; examines the financial statistics of each company it’s considering to determine if the equity securities are attractively priced; may emphasize specific industry sectors with high potential return or companies that may benefit from trends like an aging population.
Portfolio Management
| Portfolio Manager |
BMO Asset Management Inc.
|
|---|---|
| Sub-Advisor |
- |
Management and Organization
| Fund Manager |
BMO Investments Inc. |
|---|---|
| Custodian |
State Street Trust Company Canada |
| Registrar |
State Street Trust Company Canada Bank of Montreal Investment Services |
| Distributor |
BMO Investments Inc. |
Investment Minimums
| RSP Eligible | Yes |
|---|---|
| PAC Allowed | Yes |
| PAC Initial Investment | 50 |
| PAC Subsequent | 50 |
| SWP Allowed | Yes |
| SWP Min Balance | 10,000 |
| SWP Min Withdrawal | 100 |
Fees
| MER | 2.06% |
|---|---|
| Management Fee | 2.00% |
| Load | No Load |
| FE Max | - |
| DSC Max | - |
| Trailer Fee Max (FE) | - |
| Trailer Fee Max (DSC) | - |
| Trailer Fee Max (NL) | 1.00% |
| Trailer Fee Max (LL) | - |
Try Fund Library Premium
Free with a 30 day trial!
Gain access to
- Unlimited Watchlists
- Advanced Search Filtering
- Fund Comparisons
- Portfolio Scenarios
- Customizable PDF Reports
- Portfolio Rebalancer new
