Try Fund Library Premium
Free with a 30 day trial!
Gain access to
- Unlimited Watchlists
- Advanced Search Filtering
- Fund Comparisons
- Portfolio Scenarios
- Customizable PDF Reports
- Portfolio Rebalancer new
Global X Enhanced Equal Weight Canadian Telecommunication Covered Call ETF (RNCL : TSX)
Alternative Equity Focus
 Click for more information on Fundata’s ESG Grade
Fundata ESG Grade A
Click for more information on Fundata’s ESG Grade.
|
Close (06-29-2026) |
$18.06 |
|---|---|
| Change |
-$0.55
(-2.96%)
|
| Open | $18.36 |
|---|---|
| Day Range | $18.06 - $18.36 |
| Volume | 1,889 |
As at May 31, 2026
As at May 31, 2026
As at May 31, 2026
Legend
Compare Options
Fund Returns
Inception Return (April 29, 2025): 13.36%
| Row Heading | Return | Annualized Return | ||||||||||||
|---|---|---|---|---|---|---|---|---|---|---|---|---|---|---|
| 1 Mth | 3 Mth | 6 Mth | YTD | 1 Yr | 2 Yr | 3 Yr | 4 Yr | 5 Yr | 6 Yr | 7 Yr | 8 Yr | 9 Yr | 10 Yr | |
| Fund | 6.26% | -3.93% | 0.34% | 2.03% | 10.54% | - | - | - | - | - | - | - | - | - |
| Benchmark | 2.52% | 1.83% | 12.07% | 10.61% | 36.06% | 28.34% | 24.64% | 17.23% | 15.30% | 18.20% | 15.06% | 13.48% | 12.83% | 12.77% |
| Category Average | 2.82% | 9.17% | 9.17% | 9.21% | 23.49% | 15.75% | 16.26% | 11.26% | 9.16% | 11.53% | 9.52% | - | - | - |
| Category Rank | 56 / 260 | 233 / 257 | 213 / 244 | 200 / 246 | 161 / 218 | - | - | - | - | - | - | - | - | - |
| Quartile Ranking | 1 | 4 | 4 | 4 | 3 | - | - | - | - | - | - | - | - | - |
Monthly Return
| Return % | Jun | Jul | Aug | Sep | Oct | Nov | Dec | Jan | Feb | Mar | Apr | May |
|---|---|---|---|---|---|---|---|---|---|---|---|---|
| Fund | 5.08% | 5.23% | 4.73% | -2.33% | 0.60% | -3.19% | -1.66% | 3.45% | 2.66% | -0.93% | -8.74% | 6.26% |
| Benchmark | 2.91% | 1.69% | 4.96% | 5.40% | 0.97% | 3.86% | 1.32% | 0.84% | 7.72% | -4.32% | 3.81% | 2.52% |
Best Monthly Return Since Inception
6.26% (May 2026)
Worst Monthly Return Since Inception
-8.74% (April 2026)
Calendar Return (%)
| Return % | 2016 | 2017 | 2018 | 2019 | 2020 | 2021 | 2022 | 2023 | 2024 | 2025 |
|---|---|---|---|---|---|---|---|---|---|---|
| Fund | - | - | - | - | - | - | - | - | - | - |
| Benchmark | 21.08% | 9.10% | -8.89% | 22.88% | 5.60% | 25.09% | -5.84% | 11.75% | 21.65% | 31.68% |
| Category Average | - | - | - | - | 5.11% | 17.27% | -5.96% | 6.54% | 16.58% | 15.40% |
| Quartile Ranking | - | - | - | - | - | - | - | - | - | - |
| Category Rank | - | - | - | - | - | - | - | - | - | - |
Best Calendar Return (Last 10 years)
-
Worst Calendar Return (Last 10 years)
-
Asset Allocation
| Name | Percent |
|---|---|
| Canadian Equity | 97.88 |
| Cash and Equivalents | 2.12 |
Sector Allocation
| Name | Percent |
|---|---|
| Telecommunications | 97.88 |
| Cash and Cash Equivalent | 2.12 |
Geographic Allocation
| Name | Percent |
|---|---|
| North America | 100.00 |
Top Holdings
| Name | Percent |
|---|---|
| Global X Equal Weight Cdn Telecomm Idx ETF (RING) | 97.89 |
| Cash and Cash Equivalents | 2.11 |
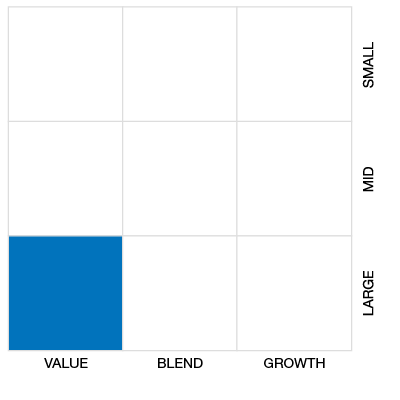
Equity Style
Fixed Income Style

Risk vs Return (3 Yr)
3 Yr Annualized
| Standard Deviation | - | - | - |
|---|---|---|---|
| Beta | - | - | - |
| Alpha | - | - | - |
| Rsquared | - | - | - |
| Sharpe | - | - | - |
| Sortino | - | - | - |
| Treynor | - | - | - |
| Tax Efficiency | - | - | - |
| Volatility | - | - | - |
Risk Rating

Annualized Key Ratio Period Comparison
| Key Ratio | 1 Yr | 3 Yr | 5 Yr | 10 Yr |
|---|---|---|---|---|
| Standard Deviation | 15.46% | - | - | - |
| Beta | 0.01% | - | - | - |
| Alpha | 0.11% | - | - | - |
| Rsquared | 0.00% | - | - | - |
| Sharpe | 0.57% | - | - | - |
| Sortino | 0.80% | - | - | - |
| Treynor | 8.89% | - | - | - |
| Tax Efficiency | - | - | - | - |
Fundata ESG Metrics
Fundata ESG Score
The E, S, and G scores are averaged for each security in the portfolio, to arrive at an ESG score for each security. We take the portfolio weighted average of the ESG scores for each fund and rank them against their peers to arrive at the Fundata ESG Score from 0-100.
Fundata E Score
Three scores under the Environment bucket are averaged to yield the Fundata Environment Score for each fund from 0-100: (1) Pollution Prevention, (2) Environmental Transparency, (3) Resource Efficiency.
Fundata S Score
Six scores under the Social bucket are averaged to yield the Fundata Social Score for each fund from 0-100. (1) Compensation and Satisfaction, (2) Diversity and Rights, (3) Education and Work Conditions, (4) Community and Charity, (5) Human Rights, (6) Sustainability Integration.
Fundata G Score
Three scores under the governance bucket are averaged to yield the Fundata Governance Score for each fund from 0-100: (1) Board Effectiveness, (2) Management Ethics, (3) Disclosure and Accountability.
Powered by OWL Analytics. For more information, please contact Fundata Canada.
Fund Details
| Start Date | April 29, 2025 |
|---|---|
| Instrument Type | Exchange Traded Fund (Alternative) |
| Share Class | Do-It-Yourself |
| Legal Status | - |
| Sales Status | Open |
| Currency | CAD |
| Distribution Frequency | Monthly |
| Assets ($mil) | - |
| 52 Week High | $24.21 |
| 52 Week Low | $18.03 |
| Annual Dividend | $2.74 |
| Annual Yield | - |
| Index | - |
| Shares Outstanding | - |
| Registered Plan Eligible | Yes |
ETF Characteristics
| Exposure | - |
|---|---|
| Asset Class High | - |
| Asset Class Medium | - |
| Asset Class Low | - |
| Leveraged | - |
| Inverse | - |
| Advisor Series | - |
| Covered Call Strategy | No |
Investment Objectives
RNCL seeks to provide, to the extent reasonably possible and net of expenses: (a) exposure to the performance of an equal-weighted index designed to provide exposure to the largest Canadian telecommunication companies (currently, the Mirae Asset Equal Weight Canadian Telecommunications Index); and (b) high monthly distributions of dividend income and call option premiums. To generate income, RNCL is exposed to a dynamic covered call option writing program.
Investment Strategy
Each Covered Call ETF invests in its own portfolio of equity or fixed income securities. Each Covered Call ETF will also, to mitigate downside risk and generate premiums, generally write options on up to approximately 50% of the value of the Options Writing ETF’s portfolio. Notwithstanding the foregoing, a Covered Call ETF may write options on a greater or lesser percentage of the portfolio, from time to time, at the discretion of the Manager.
Portfolio Management
| Portfolio Manager |
Global X Investments Canada Inc. |
|---|---|
| Sub-Advisor |
- |
Management and Organization
| Fund Manager |
Global X Investments Canada Inc. |
|---|---|
| Custodian |
CIBC Mellon Trust Company |
| Registrar |
TSX Trust Company |
| Distributor |
- |
Fees
| MER | - |
|---|---|
| Management Fee | 0.65% |
Try Fund Library Premium
Free with a 30 day trial!
Gain access to
- Unlimited Watchlists
- Advanced Search Filtering
- Fund Comparisons
- Portfolio Scenarios
- Customizable PDF Reports
- Portfolio Rebalancer new
