Try Fund Library Premium
Free with a 30 day trial!
U.S. Equity
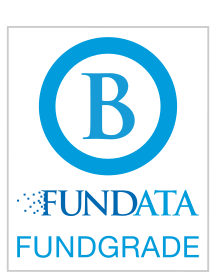 Click for more information on Fundata’s FundGrade
Click for more information on Fundata’s FundGrade.
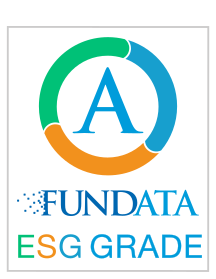 Click for more information on Fundata’s ESG Grade
Click for more information on Fundata’s ESG Grade.
|
Close (05-25-2026) |
$49.00 |
|---|---|
| Change |
$0.53
(1.09%)
|
| Open | $48.80 |
|---|---|
| Day Range | $48.80 - $48.80 |
| Volume | 200 |
As at April 30, 2026
As at April 30, 2026
As at April 30, 2026
 Loading......
Loading......
Loading......
Inception Return (March 05, 2020): 15.71%
| Row Heading | Return | Annualized Return | ||||||||||||
|---|---|---|---|---|---|---|---|---|---|---|---|---|---|---|
| 1 Mth | 3 Mth | 6 Mth | YTD | 1 Yr | 2 Yr | 3 Yr | 4 Yr | 5 Yr | 6 Yr | 7 Yr | 8 Yr | 9 Yr | 10 Yr | |
| Fund | 9.81% | 2.71% | 5.54% | 4.36% | 30.34% | 18.40% | 19.43% | 14.95% | 12.14% | 16.92% | - | - | - | - |
| Benchmark | 8.00% | 4.67% | 3.05% | 5.07% | 29.27% | 20.67% | 21.83% | 18.48% | 15.51% | 17.64% | 15.67% | 16.04% | 14.93% | 16.21% |
| Category Average | 7.94% | 2.31% | 2.31% | 3.71% | 22.90% | 15.02% | 16.87% | 13.61% | 10.56% | 13.99% | 11.69% | 11.79% | 11.20% | 12.09% |
| Category Rank | 325 / 1,400 | 785 / 1,387 | 243 / 1,374 | 546 / 1,381 | 196 / 1,314 | 351 / 1,243 | 455 / 1,180 | 508 / 1,124 | 397 / 1,068 | 180 / 1,009 | - | - | - | - |
| Quartile Ranking | 1 | 3 | 1 | 2 | 1 | 2 | 2 | 2 | 2 | 1 | - | - | - | - |
| Return % | May | Jun | Jul | Aug | Sep | Oct | Nov | Dec | Jan | Feb | Mar | Apr |
|---|---|---|---|---|---|---|---|---|---|---|---|---|
| Fund | 5.43% | 5.33% | 2.50% | 2.17% | 3.50% | 2.60% | 0.58% | 0.54% | 1.60% | -1.06% | -5.46% | 9.81% |
| Benchmark | 5.88% | 4.21% | 3.75% | 1.28% | 5.00% | 3.05% | -0.03% | -1.89% | 0.38% | -0.17% | -2.91% | 8.00% |
12.31% (April 2020)
-14.49% (March 2020)
| Return % | 2016 | 2017 | 2018 | 2019 | 2020 | 2021 | 2022 | 2023 | 2024 | 2025 |
|---|---|---|---|---|---|---|---|---|---|---|
| Fund | - | - | - | - | - | 30.88% | -18.86% | 25.97% | 22.41% | 16.18% |
| Benchmark | 8.65% | 13.80% | 3.98% | 25.18% | 16.07% | 28.16% | -12.52% | 23.32% | 36.01% | 12.28% |
| Category Average | 6.16% | 13.43% | -2.19% | 22.72% | 13.97% | 23.22% | -14.41% | 18.85% | 26.98% | 8.65% |
| Quartile Ranking | - | - | - | - | - | 1 | 3 | 2 | 3 | 1 |
| Category Rank | - | - | - | - | - | 59/ 1,050 | 729/ 1,095 | 307/ 1,150 | 921/ 1,230 | 56/ 1,274 |
30.88% (2021)
-18.86% (2022)
| Name | Percent |
|---|---|
| US Equity | 96.32 |
| International Equity | 3.29 |
| Cash and Equivalents | 0.39 |
| Name | Percent |
|---|---|
| Technology | 50.44 |
| Financial Services | 11.74 |
| Healthcare | 9.10 |
| Consumer Services | 6.32 |
| Industrial Goods | 5.16 |
| Other | 17.24 |
| Name | Percent |
|---|---|
| North America | 96.71 |
| Europe | 3.16 |
| Latin America | 0.12 |
| Other | 0.01 |
| Name | Percent |
|---|---|
| NVIDIA Corp | 11.57 |
| Apple Inc | 9.51 |
| Microsoft Corp | 7.23 |
| Alphabet Inc Cl A | 5.35 |
| Alphabet Inc Cl C | 4.26 |
| Meta Platforms Inc Cl A | 3.19 |
| Eli Lilly and Co | 1.77 |
| Exxon Mobil Corp | 1.54 |
| Micron Technology Inc | 1.39 |
| Walmart Inc | 1.38 |
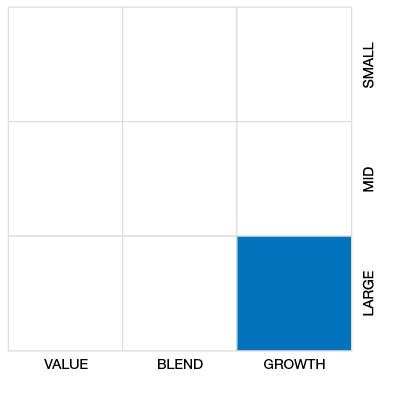

Invesco S&P 500 ESG Index ETF (CAD Hedged)
Median
Other - U.S. Equity
| Standard Deviation | 12.97% | 15.99% | - |
|---|---|---|---|
| Beta | 0.98% | 1.10% | - |
| Alpha | -0.02% | -0.04% | - |
| Rsquared | 0.79% | 0.86% | - |
| Sharpe | 1.16% | 0.62% | - |
| Sortino | 2.28% | 0.94% | - |
| Treynor | 0.15% | 0.09% | - |
| Tax Efficiency | 97.70% | 96.43% | - |
| Volatility |

|

|
- |

| Key Ratio | 1 Yr | 3 Yr | 5 Yr | 10 Yr |
|---|---|---|---|---|
| Standard Deviation | 13.00% | 12.97% | 15.99% | - |
| Beta | 1.04% | 0.98% | 1.10% | - |
| Alpha | 0.00% | -0.02% | -0.04% | - |
| Rsquared | 0.84% | 0.79% | 0.86% | - |
| Sharpe | 1.94% | 1.16% | 0.62% | - |
| Sortino | 4.19% | 2.28% | 0.94% | - |
| Treynor | 0.24% | 0.15% | 0.09% | - |
| Tax Efficiency | 98.60% | 97.70% | 96.43% | - |
The E, S, and G scores are averaged for each security in the portfolio, to arrive at an ESG score for each security. We take the portfolio weighted average of the ESG scores for each fund and rank them against their peers to arrive at the Fundata ESG Score from 0-100.
Three scores under the Environment bucket are averaged to yield the Fundata Environment Score for each fund from 0-100: (1) Pollution Prevention, (2) Environmental Transparency, (3) Resource Efficiency.
Six scores under the Social bucket are averaged to yield the Fundata Social Score for each fund from 0-100. (1) Compensation and Satisfaction, (2) Diversity and Rights, (3) Education and Work Conditions, (4) Community and Charity, (5) Human Rights, (6) Sustainability Integration.
Three scores under the governance bucket are averaged to yield the Fundata Governance Score for each fund from 0-100: (1) Board Effectiveness, (2) Management Ethics, (3) Disclosure and Accountability.
Powered by OWL Analytics. For more information, please contact Fundata Canada.
| Start Date | March 05, 2020 |
|---|---|
| Instrument Type | Exchange Traded Fund (Responsible Investment) |
| Share Class | Do-It-Yourself |
| Legal Status | Trust |
| Sales Status | Open |
| Currency | CAD |
| Distribution Frequency | Quarterly |
| Assets ($mil) | $904 |
| 52 Week High | $48.95 |
| 52 Week Low | $37.90 |
| Annual Dividend | $0.39 |
| Annual Yield | - |
| Index | S&P 500 ESG Index |
| Shares Outstanding | - |
| Registered Plan Eligible | Yes |
| Exposure | 1x performance |
|---|---|
| Asset Class High | - |
| Asset Class Medium | - |
| Asset Class Low | - |
| Leveraged | - |
| Inverse | - |
| Advisor Series | - |
| Covered Call Strategy | No |
Invesco S&P 500 ESG Index ETF seeks to replicate, to the extent reasonably possible and before fees and expenses, the performance of the S&P 500® Scored & Screened Index, or any successor thereto, on an unhedged basis, in the case of any unhedged units, or on a hedged basis, in the case of any hedged units. This Invesco ETF invests, directly or indirectly, primarily in equity securities of companies listed in the United States.
To achieve these objectives, the portfolio management team will seek direct or indirect exposure to the securities that make up the Index. The Fund intends to invest primarily in CAD Hedged Units of Invesco S&P 500 ESG Index ETF (the underlying fund ) which also tracks the performance of the Index on a hedged basis. There will be no duplication of management fees between the Fund and the underlying fund. See Fees and expenses - Fund of fund fees and expenses on page 60 for more details.
| Portfolio Manager |
Invesco Canada Ltd. |
|---|---|
| Sub-Advisor |
Invesco Capital Management LLC
NEI Investments
|
| Fund Manager |
Invesco Canada Ltd. |
|---|---|
| Custodian |
CIBC Mellon Trust Company |
| Registrar |
TSX Trust Company |
| Distributor |
- |
| MER | 0.17% |
|---|---|
| Management Fee | 0.15% |
Try Fund Library Premium
Free with a 30 day trial!
 Fund Library
