Try Fund Library Premium
Free with a 30 day trial!
Global Corp Fixed Income
 Click for more information on Fundata’s FundGrade
Click for more information on Fundata’s FundGrade.
|
Close (05-29-2026) |
$12.58 |
|---|---|
| Change |
$0.01
(0.08%)
|
| Open | $12.64 |
|---|---|
| Day Range | $12.57 - $12.64 |
| Volume | 10,336 |
As at April 30, 2026
As at April 30, 2026
 Loading......
Loading......
Loading......
Inception Return (March 20, 2013): 2.44%
| Row Heading | Return | Annualized Return | ||||||||||||
|---|---|---|---|---|---|---|---|---|---|---|---|---|---|---|
| 1 Mth | 3 Mth | 6 Mth | YTD | 1 Yr | 2 Yr | 3 Yr | 4 Yr | 5 Yr | 6 Yr | 7 Yr | 8 Yr | 9 Yr | 10 Yr | |
| Fund | 0.36% | -0.67% | -0.22% | -0.68% | 3.88% | 5.67% | 3.76% | 3.01% | 0.16% | 0.90% | 1.81% | 2.39% | 1.93% | 1.94% |
| Benchmark | -1.14% | -0.33% | -2.03% | -0.54% | 3.78% | 6.83% | 5.49% | 5.64% | 2.44% | 1.31% | 2.36% | 3.05% | 2.42% | 3.19% |
| Category Average | 0.45% | 0.37% | 0.37% | 0.35% | 4.10% | 5.74% | 5.05% | 3.88% | 1.71% | 2.62% | 2.66% | 2.80% | - | - |
| Category Rank | 128 / 229 | 192 / 224 | 143 / 220 | 209 / 224 | 83 / 208 | 70 / 158 | 117 / 149 | 97 / 135 | 103 / 123 | 92 / 114 | 74 / 108 | 59 / 93 | 56 / 84 | 57 / 78 |
| Quartile Ranking | 3 | 4 | 3 | 4 | 2 | 2 | 4 | 3 | 4 | 4 | 3 | 3 | 3 | 3 |
| Return % | May | Jun | Jul | Aug | Sep | Oct | Nov | Dec | Jan | Feb | Mar | Apr |
|---|---|---|---|---|---|---|---|---|---|---|---|---|
| Fund | 0.03% | 1.67% | 0.01% | 1.11% | 1.01% | 0.22% | 0.74% | -0.28% | -0.02% | 1.26% | -2.25% | 0.36% |
| Benchmark | -0.29% | 1.53% | 0.68% | 0.72% | 2.50% | 0.66% | 0.01% | -1.51% | -0.21% | 1.50% | -0.67% | -1.14% |
5.94% (November 2023)
-7.49% (March 2020)
| Return % | 2016 | 2017 | 2018 | 2019 | 2020 | 2021 | 2022 | 2023 | 2024 | 2025 |
|---|---|---|---|---|---|---|---|---|---|---|
| Fund | 4.79% | 4.65% | -3.00% | 13.22% | 8.51% | -2.02% | -14.50% | 7.68% | 1.65% | 7.27% |
| Benchmark | 0.66% | 2.08% | 5.22% | 5.81% | 8.39% | -3.78% | -10.63% | 6.54% | 10.41% | 5.13% |
| Category Average | - | - | - | 9.03% | 6.89% | 0.56% | -10.54% | 7.62% | 5.63% | 4.93% |
| Quartile Ranking | 3 | 2 | 4 | 1 | 1 | 4 | 4 | 2 | 4 | 1 |
| Category Rank | 57/ 78 | 37/ 84 | 81/ 92 | 4/ 105 | 17/ 110 | 108/ 118 | 108/ 132 | 66/ 149 | 139/ 151 | 4/ 196 |
13.22% (2019)
-14.50% (2022)
| Name | Percent |
|---|---|
| Foreign Corporate Bonds | 96.94 |
| Cash and Equivalents | 2.50 |
| US Equity | 0.28 |
| Foreign Bonds - Other | 0.18 |
| Canadian Corporate Bonds | 0.11 |
| Name | Percent |
|---|---|
| Fixed Income | 97.21 |
| Cash and Cash Equivalent | 2.51 |
| Financial Services | 0.28 |
| Name | Percent |
|---|---|
| North America | 99.11 |
| Europe | 0.53 |
| Asia | 0.11 |
| Other | 0.25 |
| Name | Percent |
|---|---|
| BMO Mid-Term US IG Corporate Bond Index ETF (ZIC) | 97.50 |
| CAD Currency Forward | 2.79 |
| CANADIAN DOLLAR | 0.03 |
| US DOLLAR | 0.00 |
| USD Currency Forward | -0.32 |
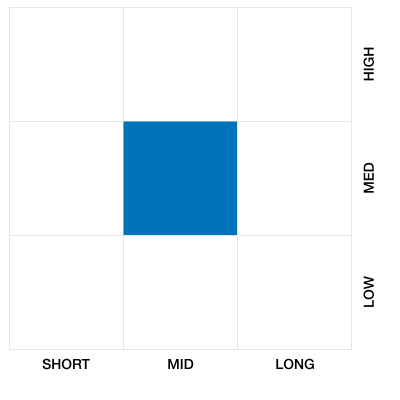
BMO Mid-Term U.S. IG Corporate Bond Hedged to CAD Index ETF
Median
Other - Global Corp Fixed Income
| Standard Deviation | 6.21% | 7.53% | 6.71% |
|---|---|---|---|
| Beta | 0.74% | 0.86% | 0.63% |
| Alpha | 0.00% | -0.02% | 0.00% |
| Rsquared | 0.33% | 0.51% | 0.35% |
| Sharpe | 0.04% | -0.32% | 0.04% |
| Sortino | 0.22% | -0.45% | -0.17% |
| Treynor | 0.00% | -0.03% | 0.00% |
| Tax Efficiency | 55.02% | - | 22.42% |
| Volatility |

|
|

|

| Key Ratio | 1 Yr | 3 Yr | 5 Yr | 10 Yr |
|---|---|---|---|---|
| Standard Deviation | 3.51% | 6.21% | 7.53% | 6.71% |
| Beta | 0.54% | 0.74% | 0.86% | 0.63% |
| Alpha | 0.02% | 0.00% | -0.02% | 0.00% |
| Rsquared | 0.39% | 0.33% | 0.51% | 0.35% |
| Sharpe | 0.42% | 0.04% | -0.32% | 0.04% |
| Sortino | 0.33% | 0.22% | -0.45% | -0.17% |
| Treynor | 0.03% | 0.00% | -0.03% | 0.00% |
| Tax Efficiency | 55.52% | 55.02% | - | 22.42% |
| Start Date | March 20, 2013 |
|---|---|
| Instrument Type | Exchange Traded Fund |
| Share Class | Do-It-Yourself |
| Legal Status | Trust |
| Sales Status | Open |
| Currency | CAD |
| Distribution Frequency | Monthly |
| Assets ($mil) | $3,597 |
| 52 Week High | $13.09 |
| 52 Week Low | $12.30 |
| Annual Dividend | $0.56 |
| Annual Yield | - |
| Index | Bloomberg Barclays US Investment Grade 5 to 10 Year Corporate Bond Capped Index CAD Hedged |
| Shares Outstanding | - |
| Registered Plan Eligible | Yes |
| Exposure | 1x performance |
|---|---|
| Asset Class High | - |
| Asset Class Medium | - |
| Asset Class Low | - |
| Leveraged | - |
| Inverse | - |
| Advisor Series | - |
| Covered Call Strategy | No |
The BMO Mid-Term US IG Corporate Bond Hedged to CAD Index ETF has been designed to replicate, to the extent possible, the performance of the Barclay's U.S. Investment Grade 5-10 Year Corporate Bond CAD Hedged Index, net of expenses.
The investment strategy of ZMU is currently to invest in and hold the Constituent Securities of the Barclays US Investment Grade 5 to 10 Year Corporate Bond Capped Index CAD Hedged in the same proportion as they are reflected in the index or securities intended to replicate the performance of the Index. The Manager may also use a sampling methodology in selecting investments for the ETF. The U.S. dollar currency exposure is hedged back to Canadian dollars.
| Portfolio Manager |
BMO Asset Management Inc. |
|---|---|
| Sub-Advisor |
- |
| Fund Manager |
BMO Asset Management Inc. |
|---|---|
| Custodian |
State Street Trust Company Canada |
| Registrar |
State Street Trust Company Canada |
| Distributor |
- |
| MER | 0.28% |
|---|---|
| Management Fee | 0.25% |
Try Fund Library Premium
Free with a 30 day trial!
 Fund Library
