Join Fund Library now and get free access to personalized features to help you manage your investments.
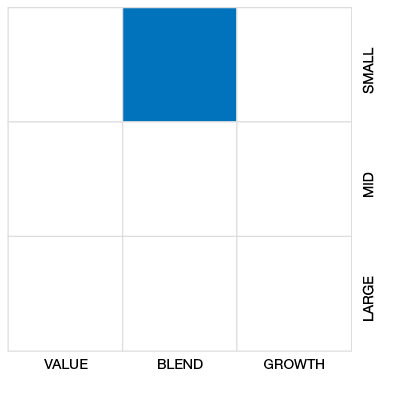
Global Small/Mid Cap Eq
 Click for more information on Fundata’s FundGrade
Click for more information on Fundata’s FundGrade.
 Click for more information on Fundata’s ESG Grade
Click for more information on Fundata’s ESG Grade.

2016
Click for more information on Fundata’s FundGrade
|
NAVPS (05-08-2024) |
$40.55 |
|---|---|
| Change |
$0.33
(0.82%)
|
As at April 30, 2024
As at April 30, 2024
As at February 29, 2024
Inception Return (July 02, 2002): 7.03%
| Row Heading | Return | Annualized Return | ||||||||||||
|---|---|---|---|---|---|---|---|---|---|---|---|---|---|---|
| 1 Mth | 3 Mth | 6 Mth | YTD | 1 Yr | 2 Yr | 3 Yr | 4 Yr | 5 Yr | 6 Yr | 7 Yr | 8 Yr | 9 Yr | 10 Yr | |
| Fund | -0.21% | 13.63% | 24.04% | 13.19% | 30.22% | 26.07% | 15.71% | 22.71% | 12.34% | 8.34% | 6.13% | 8.28% | 8.19% | 8.59% |
| Benchmark | -3.18% | 5.85% | 17.91% | 4.23% | 13.66% | 9.09% | 3.29% | 11.85% | 6.73% | 6.36% | 6.47% | 8.73% | 7.45% | 8.39% |
| Category Average | -3.00% | 16.10% | 16.10% | 2.98% | 9.69% | 6.68% | 0.43% | 9.80% | 5.16% | 4.16% | 4.31% | 5.97% | 4.65% | 5.33% |
| Category Rank | 10 / 269 | 3 / 266 | 12 / 266 | 5 / 266 | 3 / 258 | 3 / 237 | 3 / 217 | 3 / 198 | 14 / 176 | 7 / 148 | 55 / 137 | 40 / 132 | 8 / 107 | 12 / 88 |
| Quartile Ranking | 1 | 1 | 1 | 1 | 1 | 1 | 1 | 1 | 1 | 1 | 2 | 2 | 1 | 1 |
| Return % | May | Jun | Jul | Aug | Sep | Oct | Nov | Dec | Jan | Feb | Mar | Apr |
|---|---|---|---|---|---|---|---|---|---|---|---|---|
| Fund | -1.77% | 2.63% | 6.35% | 2.79% | -3.04% | -1.74% | 5.71% | 3.67% | -0.39% | 4.16% | 9.32% | -0.21% |
| Benchmark | -2.87% | 4.01% | 4.07% | -0.53% | -4.79% | -3.18% | 7.14% | 5.59% | -1.54% | 5.26% | 3.87% | -3.18% |
23.80% (April 2009)
-18.69% (October 2008)
| Return % | 2014 | 2015 | 2016 | 2017 | 2018 | 2019 | 2020 | 2021 | 2022 | 2023 |
|---|---|---|---|---|---|---|---|---|---|---|
| Fund | 8.10% | 22.18% | 14.18% | 1.74% | -14.14% | -0.15% | 7.05% | 21.77% | -2.53% | 30.18% |
| Benchmark | 9.59% | 16.61% | 7.47% | 15.40% | -7.34% | 20.09% | 11.07% | 15.50% | -13.14% | 14.59% |
| Category Average | 6.30% | 9.56% | 3.48% | 12.62% | -10.42% | 13.76% | 14.53% | 12.37% | -15.59% | 12.82% |
| Quartile Ranking | 3 | 2 | 1 | 4 | 4 | 4 | 3 | 1 | 1 | 1 |
| Category Rank | 56/ 87 | 35/ 103 | 20/ 132 | 137/ 137 | 141/ 147 | 173/ 173 | 126/ 179 | 10/ 214 | 27/ 236 | 4/ 252 |
30.18% (2023)
-14.14% (2018)
| Name | Percent |
|---|---|
| International Equity | 69.31 |
| US Equity | 24.64 |
| Canadian Equity | 3.36 |
| Cash and Equivalents | 2.68 |
| Other | 0.01 |
| Name | Percent |
|---|---|
| Industrial Goods | 23.82 |
| Consumer Goods | 14.52 |
| Financial Services | 11.71 |
| Healthcare | 10.48 |
| Technology | 10.38 |
| Other | 29.09 |
| Name | Percent |
|---|---|
| Europe | 42.60 |
| North America | 30.69 |
| Asia | 18.43 |
| Latin America | 8.28 |
| Name | Percent |
|---|---|
| Embraer SA | 4.54 |
| Pax Global Technology Ltd | 2.92 |
| Yue Yuen Industrial (Holdings) Ltd | 2.88 |
| CASH | 2.68 |
| Rolls-Royce Holdings PLC | 2.58 |
| C&C Group PLC | 2.53 |
| Linea Drct Asgrdr SA Cia de Sgrs y Rsgrs | 2.51 |
| NETGEAR Inc | 2.51 |
| Millicom International Cellular SA | 2.44 |
| Greencore Group PLC | 2.38 |

Brandes Global Small Cap Equity Fund Series A
Median
Other - Global Small/Mid Cap Eq
| Standard Deviation | 14.76% | 16.96% | 13.92% |
|---|---|---|---|
| Beta | 0.81% | 0.88% | 0.84% |
| Alpha | 0.12% | 0.06% | 0.02% |
| Rsquared | 0.67% | 0.74% | 0.71% |
| Sharpe | 0.88% | 0.66% | 0.56% |
| Sortino | 1.65% | 0.97% | 0.73% |
| Treynor | 0.16% | 0.13% | 0.09% |
| Tax Efficiency | 96.97% | 97.34% | 97.85% |
| Volatility |

|
|
|

| Key Ratio | 1 Yr | 3 Yr | 5 Yr | 10 Yr |
|---|---|---|---|---|
| Standard Deviation | 13.13% | 14.76% | 16.96% | 13.92% |
| Beta | 0.76% | 0.81% | 0.88% | 0.84% |
| Alpha | 0.17% | 0.12% | 0.06% | 0.02% |
| Rsquared | 0.72% | 0.67% | 0.74% | 0.71% |
| Sharpe | 1.73% | 0.88% | 0.66% | 0.56% |
| Sortino | 5.54% | 1.65% | 0.97% | 0.73% |
| Treynor | 0.30% | 0.16% | 0.13% | 0.09% |
| Tax Efficiency | 98.94% | 96.97% | 97.34% | 97.85% |
The E, S, and G scores are averaged for each security in the portfolio, to arrive at an ESG score for each security. We take the portfolio weighted average of the ESG scores for each fund and rank them against their peers to arrive at the Fundata ESG Score from 0-100.
Three scores under the Environment bucket are averaged to yield the Fundata Environment Score for each fund from 0-100: (1) Pollution Prevention, (2) Environmental Transparency, (3) Resource Efficiency.
Six scores under the Social bucket are averaged to yield the Fundata Social Score for each fund from 0-100. (1) Compensation and Satisfaction, (2) Diversity and Rights, (3) Education and Work Conditions, (4) Community and Charity, (5) Human Rights, (6) Sustainability Integration.
Three scores under the governance bucket are averaged to yield the Fundata Governance Score for each fund from 0-100: (1) Board Effectiveness, (2) Management Ethics, (3) Disclosure and Accountability.
Powered by OWL Analytics. For more information, please contact Fundata Canada.
| Start Date | July 02, 2002 |
|---|---|
| Instrument Type | Mutual Fund |
| Share Class | Commission Based Advice |
| Legal Status | Trust |
| Sales Status | Open |
| Currency | CAD |
| Distribution Frequency | Annual |
| Assets ($mil) | $482 |
| FundServ Code | Load Code | Sales Status |
|---|---|---|
| BIP152 | ||
| BIP211 | ||
| BIP252 |
The fundamental investment objective of Brandes Global Small Cap Equity Fund is to achieve long-term capital appreciation by investing primarily in equity securities of Canadian and non-Canadian issuers with small equity market capitalizations at the time of purchase. The Fund is not subject to any specific geographic diversification requirements.
Brandes LP is a Graham & Dodd value-oriented, global investment adviser that applies fundamental analysis to bottom-up security selection. Brandes LP believes that consistently buying businesses at discounts to conservative estimates of their intrinsic value has the potential to produce competitive long-term results.
| Name | Start Date |
|---|---|
| Robert J. Gallagher | 07-02-2002 |
| Yingbin Chen | 07-02-2002 |
| Mark Costa | 07-02-2002 |
| Brandes Investment Partners L.P. | 07-02-2002 |
| Luiz G. Sauerbronn | 07-02-2002 |
| Ralph Birchmeier | 07-02-2002 |
| Fund Manager | Bridgehouse Asset Managers |
|---|---|
| Advisor | Bridgehouse Asset Managers |
| Custodian | State Street Trust Company Canada |
| Registrar | International Financial Data Services (Canada) Ltd |
| Distributor | - |
| Auditor | PriceWaterhouseCoopers LLP |
| RSP Eligible | Yes |
|---|---|
| PAC Allowed | Yes |
| PAC Initial Investment | 1,000 |
| PAC Subsequent | 100 |
| SWP Allowed | Yes |
| SWP Min Balance | 10,000 |
| SWP Min Withdrawal | 100 |
| MER | 2.67% |
|---|---|
| Management Fee | 2.20% |
| Load | Choice of Front or No Load |
| FE Max | 5.00% |
| DSC Max | 5.50% |
| Trailer Fee Max (FE) | 1.00% |
| Trailer Fee Max (DSC) | 1.00% |
| Trailer Fee Max (NL) | - |
| Trailer Fee Max (LL) | - |
Join Fund Library now and get free access to personalized features to help you manage your investments.
 Fund Library