Try Fund Library Premium
For Free with a 30 day trial!
Natural Resources Equity
 Click for more information on Fundata’s FundGrade
Click for more information on Fundata’s FundGrade.
 Click for more information on Fundata’s ESG Grade
Click for more information on Fundata’s ESG Grade.
|
NAVPS (06-09-2025) |
$53.37 |
|---|---|
| Change |
$0.34
(0.64%)
|
As at May 31, 2025
As at May 31, 2025
As at April 30, 2025
Inception Return (November 10, 1989): 7.38%
| Row Heading | Return | Annualized Return | ||||||||||||
|---|---|---|---|---|---|---|---|---|---|---|---|---|---|---|
| 1 Mth | 3 Mth | 6 Mth | YTD | 1 Yr | 2 Yr | 3 Yr | 4 Yr | 5 Yr | 6 Yr | 7 Yr | 8 Yr | 9 Yr | 10 Yr | |
| Fund | 4.18% | -3.01% | -7.12% | -3.17% | -5.80% | 12.06% | 2.11% | 8.84% | 11.50% | 9.83% | 6.34% | 5.93% | 5.47% | 4.93% |
| Benchmark | 3.24% | 6.05% | 5.94% | 11.40% | 12.82% | 17.27% | 6.34% | 11.78% | 13.42% | 11.24% | 7.92% | 7.15% | 6.91% | 5.46% |
| Category Average | 5.15% | 2.49% | 0.06% | 5.11% | 1.44% | 10.31% | 3.31% | 9.63% | 17.38% | 12.19% | 6.51% | 6.87% | 6.45% | 4.95% |
| Category Rank | 83 / 114 | 94 / 114 | 85 / 112 | 97 / 112 | 67 / 110 | 51 / 109 | 69 / 109 | 81 / 104 | 88 / 102 | 76 / 102 | 73 / 101 | 78 / 94 | 71 / 89 | 56 / 79 |
| Quartile Ranking | 3 | 4 | 4 | 4 | 3 | 2 | 3 | 4 | 4 | 3 | 3 | 4 | 4 | 3 |
| Return % | Jun | Jul | Aug | Sep | Oct | Nov | Dec | Jan | Feb | Mar | Apr | May |
|---|---|---|---|---|---|---|---|---|---|---|---|---|
| Fund | -4.29% | 4.00% | -2.35% | -0.92% | 2.77% | 2.47% | -4.08% | 2.72% | -2.81% | -0.21% | -6.70% | 4.18% |
| Benchmark | -4.69% | 6.39% | -0.48% | 0.27% | 4.24% | 0.96% | -4.90% | 5.21% | -0.15% | 5.16% | -2.32% | 3.24% |
25.89% (April 2020)
-24.06% (March 2020)
| Return % | 2015 | 2016 | 2017 | 2018 | 2019 | 2020 | 2021 | 2022 | 2023 | 2024 |
|---|---|---|---|---|---|---|---|---|---|---|
| Fund | -15.26% | 36.13% | -1.83% | -18.74% | 24.27% | -8.36% | 24.67% | 13.48% | 5.25% | 14.57% |
| Benchmark | -23.78% | 36.74% | -1.69% | -15.86% | 20.06% | -7.01% | 21.57% | 12.86% | -0.78% | 19.24% |
| Category Average | -22.23% | 40.92% | -2.18% | -21.77% | 9.95% | 5.03% | 32.84% | 13.19% | 2.62% | 7.76% |
| Quartile Ranking | 2 | 4 | 2 | 2 | 1 | 4 | 3 | 4 | 2 | 1 |
| Category Rank | 23/ 76 | 69/ 85 | 39/ 90 | 46/ 100 | 5/ 102 | 97/ 102 | 72/ 103 | 88/ 105 | 29/ 109 | 24/ 110 |
36.13% (2016)
-18.74% (2018)
| Name | Percent |
|---|---|
| Canadian Equity | 95.55 |
| Income Trust Units | 2.99 |
| Cash and Equivalents | 1.43 |
| Other | 0.03 |
| Name | Percent |
|---|---|
| Energy | 52.75 |
| Basic Materials | 45.26 |
| Cash and Cash Equivalent | 1.43 |
| Industrial Services | 0.52 |
| Mutual Fund | 0.03 |
| Other | 0.01 |
| Name | Percent |
|---|---|
| North America | 99.97 |
| Multi-National | 0.03 |
| Name | Percent |
|---|---|
| Cenovus Energy Inc | 10.30 |
| Methanex Corp | 10.09 |
| Canadian Natural Resources Ltd | 9.85 |
| Imperial Oil Ltd | 9.46 |
| Suncor Energy Inc | 9.32 |
| Canfor Corp | 6.95 |
| Winpak Ltd | 6.64 |
| Major Drilling Group International Inc | 5.84 |
| Pason Systems Inc | 5.15 |
| CES Energy Solutions Corp | 4.34 |

NBI Resource Fund Investor Series
Median
Other - Natural Resources Equity
| Standard Deviation | 16.65% | 15.75% | 19.26% |
|---|---|---|---|
| Beta | 0.82% | 0.87% | 0.99% |
| Alpha | -0.03% | 0.00% | 0.00% |
| Rsquared | 0.73% | 0.80% | 0.91% |
| Sharpe | -0.03% | 0.62% | 0.26% |
| Sortino | 0.04% | 0.87% | 0.28% |
| Treynor | -0.01% | 0.11% | 0.05% |
| Tax Efficiency | 100.00% | 100.00% | 100.00% |
| Volatility |

|
|

|

| Key Ratio | 1 Yr | 3 Yr | 5 Yr | 10 Yr |
|---|---|---|---|---|
| Standard Deviation | 12.65% | 16.65% | 15.75% | 19.26% |
| Beta | 0.80% | 0.82% | 0.87% | 0.99% |
| Alpha | -0.16% | -0.03% | 0.00% | 0.00% |
| Rsquared | 0.70% | 0.73% | 0.80% | 0.91% |
| Sharpe | -0.69% | -0.03% | 0.62% | 0.26% |
| Sortino | -0.80% | 0.04% | 0.87% | 0.28% |
| Treynor | -0.11% | -0.01% | 0.11% | 0.05% |
| Tax Efficiency | - | 100.00% | 100.00% | 100.00% |
The E, S, and G scores are averaged for each security in the portfolio, to arrive at an ESG score for each security. We take the portfolio weighted average of the ESG scores for each fund and rank them against their peers to arrive at the Fundata ESG Score from 0-100.
Three scores under the Environment bucket are averaged to yield the Fundata Environment Score for each fund from 0-100: (1) Pollution Prevention, (2) Environmental Transparency, (3) Resource Efficiency.
Six scores under the Social bucket are averaged to yield the Fundata Social Score for each fund from 0-100. (1) Compensation and Satisfaction, (2) Diversity and Rights, (3) Education and Work Conditions, (4) Community and Charity, (5) Human Rights, (6) Sustainability Integration.
Three scores under the governance bucket are averaged to yield the Fundata Governance Score for each fund from 0-100: (1) Board Effectiveness, (2) Management Ethics, (3) Disclosure and Accountability.
Powered by OWL Analytics. For more information, please contact Fundata Canada.
| Start Date | November 10, 1989 |
|---|---|
| Instrument Type | Mutual Fund |
| Share Class | Commission Based Advice |
| Legal Status | Trust |
| Sales Status | Open |
| Currency | CAD |
| Distribution Frequency | Annual |
| Assets ($mil) | $54 |
| FundServ Code | Load Code | Sales Status |
|---|---|---|
| NBC844 |
The NBI Resource Fund aims to achieve capital growth primarily by investing in equities of Canadian natural resource companies and companies that support resource companies.
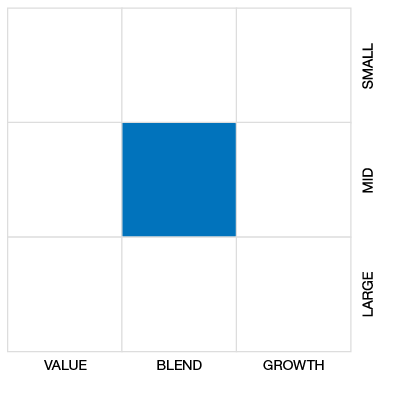
The fund seeks to achieve its objective by investing in companies that engage in natural resource activities, such as mining, oil and gas, energy, forest products, water resources and fishing, and companies that support those industries. The portfolio sub-advisor uses a combination of growth and value styles and a mix of investment strategies to select portfolio investments for the fund.
| Portfolio Manager |
National Bank Trust Inc. |
|---|---|
| Sub-Advisor |
Foyston, Gordon and Payne, Inc. |
| Fund Manager |
National Bank Investments Inc. |
|---|---|
| Custodian |
Natcan Trust Company |
| Registrar |
Natcan Trust Company |
| Distributor |
National Bank Investments Inc. |
| RSP Eligible | Yes |
|---|---|
| PAC Allowed | Yes |
| PAC Initial Investment | 25 |
| PAC Subsequent | 25 |
| SWP Allowed | Yes |
| SWP Min Balance | 10,000 |
| SWP Min Withdrawal | 25 |
| MER | 2.19% |
|---|---|
| Management Fee | 1.75% |
| Load | No Load |
| FE Max | - |
| DSC Max | - |
| Trailer Fee Max (FE) | - |
| Trailer Fee Max (DSC) | - |
| Trailer Fee Max (NL) | 1.00% |
| Trailer Fee Max (LL) | - |
Try Fund Library Premium
For Free with a 30 day trial!
 Fund Library