Try Fund Library Premium
For Free with a 30 day trial!
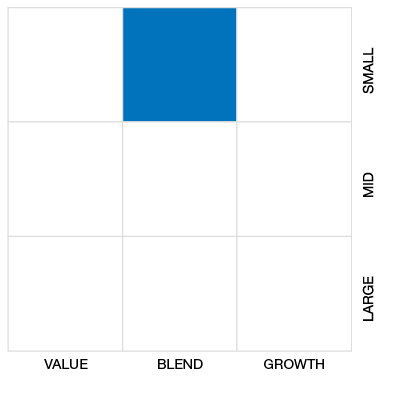
Global Small/Mid Cap Eq
|
NAVPS (06-12-2025) |
$11.86 |
|---|---|
| Change |
$0.01
(0.11%)
|
As at May 31, 2025
As at March 31, 2025
Inception Return (May 22, 2024): 17.25%
| Row Heading | Return | Annualized Return | ||||||||||||
|---|---|---|---|---|---|---|---|---|---|---|---|---|---|---|
| 1 Mth | 3 Mth | 6 Mth | YTD | 1 Yr | 2 Yr | 3 Yr | 4 Yr | 5 Yr | 6 Yr | 7 Yr | 8 Yr | 9 Yr | 10 Yr | |
| Fund | 5.57% | 5.00% | 7.70% | 8.06% | - | - | - | - | - | - | - | - | - | - |
| Benchmark | 5.68% | -1.75% | -4.06% | -1.05% | 9.42% | 14.83% | 10.76% | 5.74% | 10.79% | 8.77% | 6.88% | 7.29% | 8.61% | 7.52% |
| Category Average | 5.70% | 0.86% | -0.91% | 1.66% | 6.63% | 11.23% | 8.33% | 2.85% | 8.85% | 7.08% | 4.89% | 5.05% | 6.09% | 4.95% |
| Category Rank | 111 / 281 | 39 / 281 | 50 / 278 | 49 / 279 | - | - | - | - | - | - | - | - | - | - |
| Quartile Ranking | 2 | 1 | 1 | 1 | - | - | - | - | - | - | - | - | - | - |
| Return % | Jun | Jul | Aug | Sep | Oct | Nov | Dec | Jan | Feb | Mar | Apr | May |
|---|---|---|---|---|---|---|---|---|---|---|---|---|
| Fund | - | 7.74% | -1.57% | 2.03% | -1.38% | 3.01% | -0.33% | 2.50% | 0.41% | 0.55% | -1.09% | 5.57% |
| Benchmark | -1.02% | 5.44% | -1.29% | 3.07% | 0.86% | 6.51% | -3.05% | 4.42% | -3.55% | -4.14% | -3.02% | 5.68% |
7.74% (July 2024)
-1.57% (August 2024)
| Return % | 2015 | 2016 | 2017 | 2018 | 2019 | 2020 | 2021 | 2022 | 2023 | 2024 |
|---|---|---|---|---|---|---|---|---|---|---|
| Fund | - | - | - | - | - | - | - | - | - | - |
| Benchmark | 16.61% | 7.47% | 15.40% | -7.34% | 20.09% | 11.07% | 15.50% | -13.14% | 14.59% | 18.68% |
| Category Average | 9.56% | 3.48% | 12.62% | -10.42% | 13.76% | 14.53% | 12.37% | -15.59% | 12.82% | 12.04% |
| Quartile Ranking | - | - | - | - | - | - | - | - | - | - |
| Category Rank | - | - | - | - | - | - | - | - | - | - |
-
-
| Name | Percent |
|---|---|
| International Equity | 75.51 |
| US Equity | 19.09 |
| Canadian Equity | 4.15 |
| Cash and Equivalents | 0.66 |
| Income Trust Units | 0.59 |
| Name | Percent |
|---|---|
| Consumer Goods | 15.12 |
| Consumer Services | 12.96 |
| Financial Services | 11.67 |
| Real Estate | 10.80 |
| Industrial Services | 10.00 |
| Other | 39.45 |
| Name | Percent |
|---|---|
| Asia | 48.36 |
| Europe | 24.85 |
| North America | 22.26 |
| Latin America | 1.45 |
| Africa and Middle East | 1.15 |
| Other | 1.93 |
| Name | Percent |
|---|---|
| JPY Currency | - |
| Ship Healthcare Holdings Inc | - |
| MEDNAX Inc | - |
| Olvi Oyj Cl A | - |
| Metropolitan Bank Holding Corp | - |
| Seiren Co Ltd | - |
| Persol Holdings Co Ltd | - |
| B&M European Value Retail SA | - |
| Sabre Insurance Group PLC | - |
| Oak Valley Bancorp | - |

| Standard Deviation | - | - | - |
|---|---|---|---|
| Beta | - | - | - |
| Alpha | - | - | - |
| Rsquared | - | - | - |
| Sharpe | - | - | - |
| Sortino | - | - | - |
| Treynor | - | - | - |
| Tax Efficiency | - | - | - |
| Volatility | - | - | - |

| Key Ratio | 1 Yr | 3 Yr | 5 Yr | 10 Yr |
|---|---|---|---|---|
| Standard Deviation | - | - | - | - |
| Beta | - | - | - | - |
| Alpha | - | - | - | - |
| Rsquared | - | - | - | - |
| Sharpe | - | - | - | - |
| Sortino | - | - | - | - |
| Treynor | - | - | - | - |
| Tax Efficiency | - | - | - | - |
| Start Date | May 22, 2024 |
|---|---|
| Instrument Type | Mutual Fund |
| Share Class | Commission Based Advice |
| Legal Status | Trust |
| Sales Status | Open |
| Currency | CAD |
| Distribution Frequency | Annual |
| Assets ($mil) | $46 |
| FundServ Code | Load Code | Sales Status |
|---|---|---|
| FID7792 |
The Fund aims to achieve long-term capital growth by investing primarily in equity securities of micro and small capitalization companies located anywhere in the world
To meet the Fund’s objectives, the portfolio management team: • Uses a combination of fundamental and quantitative approaches to construct a portfolio that aims to identify companies with desirable fundamental characteristics that include, but are not limited to: o Attractive valuation. o High quality profile. o Above-average growth potential. o Diversification across sectors and geographic regions around the world.
| Portfolio Manager |
Fidelity Investments Canada ULC
|
|---|---|
| Sub-Advisor |
- |
| Fund Manager |
Fidelity Investments Canada ULC |
|---|---|
| Custodian |
- |
| Registrar |
- |
| Distributor |
- |
| RSP Eligible | Yes |
|---|---|
| PAC Allowed | Yes |
| PAC Initial Investment | 25 |
| PAC Subsequent | 25 |
| SWP Allowed | No |
| SWP Min Balance | - |
| SWP Min Withdrawal | - |
| MER | 2.20% |
|---|---|
| Management Fee | 1.85% |
| Load | Back Fee Only |
| FE Max | 5.00% |
| DSC Max | - |
| Trailer Fee Max (FE) | 1.00% |
| Trailer Fee Max (DSC) | - |
| Trailer Fee Max (NL) | - |
| Trailer Fee Max (LL) | - |
Try Fund Library Premium
For Free with a 30 day trial!
 Fund Library