Try Fund Library Premium
For Free with a 30 day trial!
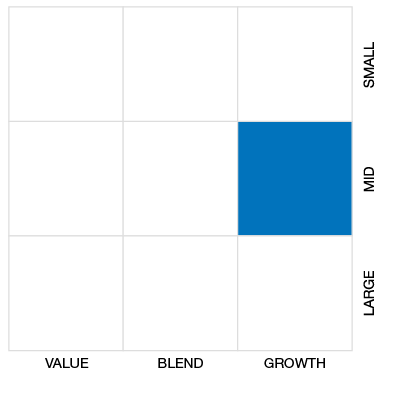
Cdn Small/Mid Cap Equity
 Click for more information on Fundata’s FundGrade
Click for more information on Fundata’s FundGrade.
|
NAVPS (06-13-2025) |
$11.93 |
|---|---|
| Change |
-$0.10
(-0.84%)
|
As at May 31, 2025
As at May 31, 2025
Inception Return (October 02, 2007): 3.97%
| Row Heading | Return | Annualized Return | ||||||||||||
|---|---|---|---|---|---|---|---|---|---|---|---|---|---|---|
| 1 Mth | 3 Mth | 6 Mth | YTD | 1 Yr | 2 Yr | 3 Yr | 4 Yr | 5 Yr | 6 Yr | 7 Yr | 8 Yr | 9 Yr | 10 Yr | |
| Fund | 6.41% | 1.31% | -5.36% | -1.74% | 13.11% | 8.64% | 3.92% | 0.13% | 8.04% | 3.79% | 2.59% | 2.16% | 2.59% | 2.38% |
| Benchmark | 7.20% | 7.94% | 2.67% | 6.17% | 13.69% | 15.51% | 6.55% | 4.89% | 14.94% | 10.11% | 6.60% | 6.56% | 6.79% | 6.16% |
| Category Average | 7.16% | 5.42% | -0.18% | 2.75% | 14.28% | 12.70% | 7.13% | 5.11% | 12.37% | 8.74% | 6.49% | 6.04% | 6.27% | 5.28% |
| Category Rank | 176 / 203 | 197 / 199 | 189 / 199 | 188 / 199 | 159 / 199 | 182 / 195 | 180 / 193 | 172 / 186 | 171 / 177 | 171 / 175 | 161 / 166 | 160 / 164 | 150 / 154 | 125 / 130 |
| Quartile Ranking | 4 | 4 | 4 | 4 | 4 | 4 | 4 | 4 | 4 | 4 | 4 | 4 | 4 | 4 |
| Return % | Jun | Jul | Aug | Sep | Oct | Nov | Dec | Jan | Feb | Mar | Apr | May |
|---|---|---|---|---|---|---|---|---|---|---|---|---|
| Fund | 4.02% | 4.34% | -0.56% | 3.23% | 0.18% | 7.10% | -3.68% | 0.55% | -3.55% | -3.94% | -0.88% | 6.41% |
| Benchmark | -1.93% | 5.81% | -1.26% | 3.80% | 1.39% | 2.69% | -3.30% | 0.65% | -2.27% | 2.56% | -1.83% | 7.20% |
14.06% (April 2020)
-26.02% (March 2020)
| Return % | 2015 | 2016 | 2017 | 2018 | 2019 | 2020 | 2021 | 2022 | 2023 | 2024 |
|---|---|---|---|---|---|---|---|---|---|---|
| Fund | -11.22% | 25.11% | -0.08% | -15.79% | 13.31% | -1.23% | 22.18% | -17.10% | 3.28% | 16.21% |
| Benchmark | -13.31% | 38.48% | 2.75% | -18.17% | 15.84% | 12.87% | 20.27% | -9.29% | 4.79% | 18.83% |
| Category Average | -6.13% | 18.01% | 3.43% | -15.15% | 16.59% | 11.91% | 22.35% | -11.32% | 6.49% | 16.84% |
| Quartile Ranking | 4 | 1 | 4 | 3 | 4 | 4 | 3 | 3 | 3 | 3 |
| Category Rank | 117/ 129 | 23/ 151 | 121/ 156 | 100/ 165 | 159/ 172 | 175/ 177 | 98/ 185 | 143/ 193 | 133/ 195 | 113/ 196 |
25.11% (2016)
-17.10% (2022)
| Name | Percent |
|---|---|
| Canadian Equity | 74.33 |
| Income Trust Units | 13.74 |
| US Equity | 6.99 |
| International Equity | 4.69 |
| Cash and Equivalents | 0.25 |
| Name | Percent |
|---|---|
| Real Estate | 22.25 |
| Financial Services | 17.53 |
| Energy | 13.24 |
| Industrial Services | 11.35 |
| Technology | 8.12 |
| Other | 27.51 |
| Name | Percent |
|---|---|
| North America | 84.94 |
| Latin America | 12.83 |
| Europe | 2.22 |
| Other | 0.01 |
| Name | Percent |
|---|---|
| Brookfield Business Partners LP - Units | 6.00 |
| Brookfield Infrastructure Partners LP - Units | 4.36 |
| Trisura Group Ltd | 4.17 |
| Cargojet Inc | 3.90 |
| GFL Environmental Inc | 3.81 |
| Element Fleet Management Corp | 3.33 |
| Stantec Inc | 3.15 |
| TFI International Inc | 3.04 |
| iA Financial Corp Inc | 2.88 |
| Brookfield Wealth Solutions Ltd Cl A | 2.47 |

Canadian Equity Small Cap Corporate Class (Series A shares)
Median
Other - Cdn Small/Mid Cap Equity
| Standard Deviation | 15.32% | 14.68% | 15.44% |
|---|---|---|---|
| Beta | 0.73% | 0.65% | 0.64% |
| Alpha | -0.01% | -0.01% | -0.02% |
| Rsquared | 0.59% | 0.58% | 0.69% |
| Sharpe | 0.07% | 0.43% | 0.12% |
| Sortino | 0.20% | 0.62% | 0.05% |
| Treynor | 0.01% | 0.10% | 0.03% |
| Tax Efficiency | 57.28% | 77.70% | 34.72% |
| Volatility |

|
|

|

| Key Ratio | 1 Yr | 3 Yr | 5 Yr | 10 Yr |
|---|---|---|---|---|
| Standard Deviation | 13.43% | 15.32% | 14.68% | 15.44% |
| Beta | 0.74% | 0.73% | 0.65% | 0.64% |
| Alpha | 0.03% | -0.01% | -0.01% | -0.02% |
| Rsquared | 0.42% | 0.59% | 0.58% | 0.69% |
| Sharpe | 0.72% | 0.07% | 0.43% | 0.12% |
| Sortino | 1.45% | 0.20% | 0.62% | 0.05% |
| Treynor | 0.13% | 0.01% | 0.10% | 0.03% |
| Tax Efficiency | 92.31% | 57.28% | 77.70% | 34.72% |
| Start Date | October 02, 2007 |
|---|---|
| Instrument Type | Mutual Fund |
| Share Class | Commission Based Advice |
| Legal Status | Corporation |
| Sales Status | Open |
| Currency | CAD |
| Distribution Frequency | Quarterly |
| Assets ($mil) | $236 |
| FundServ Code | Load Code | Sales Status |
|---|---|---|
| CIG17559 | ||
| CIG17659 | ||
| CIG17759 | ||
| CIG17859 |
The primary investment objective of the Canadian Equity Small Cap Corporate Class is to provide long-term capital growth together with the preservation of capital by investing primarily in common shares of Canadian corporations, diversified over a broad range of companies. The primary emphasis will be on small market capitalization. This fund also may invest in other mutual funds.
The portfolio adviser will employ a disciplined management style designed to capture the returns and the diversification benefits of a broad cross section of primarily Canadian small/mid cap companies. The portfolio adviser will pursue this objective by participating in the investment performance of a broad range of readily marketable Canadian common share securities.
| Portfolio Manager |
CI Global Asset Management
|
|---|---|
| Sub-Advisor |
- |
| Fund Manager |
CI Global Asset Management |
|---|---|
| Custodian |
RBC Investor Services Trust (Canada) |
| Registrar |
CI Global Asset Management |
| Distributor |
Assante Capital Management Ltd. Assante Financial Management Ltd |
| RSP Eligible | Yes |
|---|---|
| PAC Allowed | Yes |
| PAC Initial Investment | 50 |
| PAC Subsequent | 50 |
| SWP Allowed | Yes |
| SWP Min Balance | 5,000 |
| SWP Min Withdrawal | 50 |
| MER | 2.94% |
|---|---|
| Management Fee | 2.50% |
| Load | Choice of Front or No Load |
| FE Max | 4.00% |
| DSC Max | 5.50% |
| Trailer Fee Max (FE) | 1.00% |
| Trailer Fee Max (DSC) | 1.00% |
| Trailer Fee Max (NL) | - |
| Trailer Fee Max (LL) | - |
Try Fund Library Premium
For Free with a 30 day trial!
 Fund Library