Try Fund Library Premium
For Free with a 30 day trial!
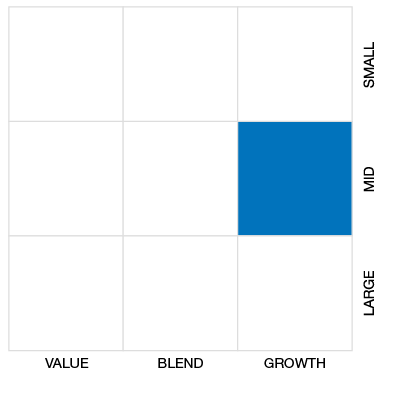
Global Small/Mid Cap Eq
 Click for more information on Fundata’s FundGrade
Click for more information on Fundata’s FundGrade.
 Click for more information on Fundata’s ESG Grade
Click for more information on Fundata’s ESG Grade.
|
NAVPS (05-23-2025) |
$15.25 |
|---|---|
| Change |
-$0.14
(-0.94%)
|
As at April 30, 2025
As at January 31, 2025
As at April 30, 2025
Inception Return (August 26, 2022): 14.82%
| Row Heading | Return | Annualized Return | ||||||||||||
|---|---|---|---|---|---|---|---|---|---|---|---|---|---|---|
| 1 Mth | 3 Mth | 6 Mth | YTD | 1 Yr | 2 Yr | 3 Yr | 4 Yr | 5 Yr | 6 Yr | 7 Yr | 8 Yr | 9 Yr | 10 Yr | |
| Fund | -0.46% | -4.35% | 1.55% | -0.60% | 14.19% | 13.04% | - | - | - | - | - | - | - | - |
| Benchmark | -3.02% | -10.33% | -3.31% | -6.36% | 6.62% | 10.09% | 8.26% | 4.11% | 10.78% | 6.71% | 6.40% | 6.49% | 8.50% | 7.37% |
| Category Average | -1.52% | -7.06% | -2.80% | -3.82% | 4.66% | 7.14% | 6.00% | 1.47% | 8.75% | 5.07% | 4.23% | 4.35% | 5.82% | 4.65% |
| Category Rank | 87 / 281 | 64 / 279 | 52 / 278 | 64 / 279 | 18 / 269 | 26 / 255 | - | - | - | - | - | - | - | - |
| Quartile Ranking | 2 | 1 | 1 | 1 | 1 | 1 | - | - | - | - | - | - | - | - |
| Return % | May | Jun | Jul | Aug | Sep | Oct | Nov | Dec | Jan | Feb | Mar | Apr |
|---|---|---|---|---|---|---|---|---|---|---|---|---|
| Fund | 4.92% | -1.54% | 7.94% | -2.20% | 2.99% | 0.12% | 3.65% | -1.43% | 3.92% | -1.70% | -2.25% | -0.46% |
| Benchmark | 2.98% | -1.02% | 5.44% | -1.29% | 3.07% | 0.86% | 6.51% | -3.05% | 4.42% | -3.55% | -4.14% | -3.02% |
7.94% (July 2024)
-7.36% (September 2022)
| Return % | 2015 | 2016 | 2017 | 2018 | 2019 | 2020 | 2021 | 2022 | 2023 | 2024 |
|---|---|---|---|---|---|---|---|---|---|---|
| Fund | - | - | - | - | - | - | - | - | 25.38% | 18.59% |
| Benchmark | 16.61% | 7.47% | 15.40% | -7.34% | 20.09% | 11.07% | 15.50% | -13.14% | 14.59% | 18.68% |
| Category Average | 9.56% | 3.48% | 12.62% | -10.42% | 13.76% | 14.53% | 12.37% | -15.59% | 12.82% | 12.04% |
| Quartile Ranking | - | - | - | - | - | - | - | - | 1 | 1 |
| Category Rank | - | - | - | - | - | - | - | - | 10/ 248 | 59/ 266 |
25.38% (2023)
18.59% (2024)
| Name | Percent |
|---|---|
| International Equity | 60.46 |
| US Equity | 22.20 |
| Canadian Equity | 17.11 |
| Cash and Equivalents | 0.23 |
| Name | Percent |
|---|---|
| Financial Services | 31.60 |
| Technology | 16.09 |
| Consumer Goods | 15.04 |
| Consumer Services | 11.14 |
| Real Estate | 7.73 |
| Other | 18.40 |
| Name | Percent |
|---|---|
| Europe | 51.47 |
| North America | 39.53 |
| Asia | 8.99 |
| Other | 0.01 |
| Name | Percent |
|---|---|
| Westaim Corp | 7.50 |
| Royal Unibrew A/S | 5.70 |
| Euronext NV | 5.59 |
| Burford Capital Ltd Cl C | 4.11 |
| Hypoport SE | 4.03 |
| Andlauer Healthcare Group Inc | 3.63 |
| Iress Ltd | 3.48 |
| Diploma PLC | 3.29 |
| Yeti Holdings Inc | 3.24 |
| Dalata Hotel Group PLC | 3.11 |

| Standard Deviation | - | - | - |
|---|---|---|---|
| Beta | - | - | - |
| Alpha | - | - | - |
| Rsquared | - | - | - |
| Sharpe | - | - | - |
| Sortino | - | - | - |
| Treynor | - | - | - |
| Tax Efficiency | - | - | - |
| Volatility | - | - | - |

| Key Ratio | 1 Yr | 3 Yr | 5 Yr | 10 Yr |
|---|---|---|---|---|
| Standard Deviation | 11.72% | - | - | - |
| Beta | 0.80% | - | - | - |
| Alpha | 0.08% | - | - | - |
| Rsquared | 0.79% | - | - | - |
| Sharpe | 0.87% | - | - | - |
| Sortino | 2.31% | - | - | - |
| Treynor | 0.13% | - | - | - |
| Tax Efficiency | 100.00% | - | - | - |
The E, S, and G scores are averaged for each security in the portfolio, to arrive at an ESG score for each security. We take the portfolio weighted average of the ESG scores for each fund and rank them against their peers to arrive at the Fundata ESG Score from 0-100.
Three scores under the Environment bucket are averaged to yield the Fundata Environment Score for each fund from 0-100: (1) Pollution Prevention, (2) Environmental Transparency, (3) Resource Efficiency.
Six scores under the Social bucket are averaged to yield the Fundata Social Score for each fund from 0-100. (1) Compensation and Satisfaction, (2) Diversity and Rights, (3) Education and Work Conditions, (4) Community and Charity, (5) Human Rights, (6) Sustainability Integration.
Three scores under the governance bucket are averaged to yield the Fundata Governance Score for each fund from 0-100: (1) Board Effectiveness, (2) Management Ethics, (3) Disclosure and Accountability.
Powered by OWL Analytics. For more information, please contact Fundata Canada.
| Start Date | August 26, 2022 |
|---|---|
| Instrument Type | Mutual Fund |
| Share Class | Commission Based Advice |
| Legal Status | Trust |
| Sales Status | Open |
| Currency | CAD |
| Distribution Frequency | Annual |
| Assets ($mil) | - |
| FundServ Code | Load Code | Sales Status |
|---|---|---|
| LEP200 |
The investment objective of the Langdon Global Smaller Companies Portfolio (the “Fund”) is to provide Unitholders with long-term capital growth by investing primarily in common shares of smaller companies in developed countries around the world. The fundamental investment objective of the Fund will not change without the consent of a majority of the voting unitholders of the Fund.
To achieve the investment objective, the Fund will invest primarily in the common shares of publicly traded small and mid cap companies on a global basis, but may also invest in other securities. The Fund may invest up to 10% of its NAV in the securities of private companies. The Fund will invest in a concentrated portfolio of securities selected by the Manager.
| Portfolio Manager |
Langdon Equity Partners Ltd.
|
|---|---|
| Sub-Advisor |
- |
| Fund Manager |
Langdon Equity Partners Ltd. |
|---|---|
| Custodian |
State Street Trust Company Canada |
| Registrar |
SGGG Fund Services Inc. |
| Distributor |
- |
| RSP Eligible | Yes |
|---|---|
| PAC Allowed | Yes |
| PAC Initial Investment | 5,000 |
| PAC Subsequent | 500 |
| SWP Allowed | No |
| SWP Min Balance | - |
| SWP Min Withdrawal | - |
| MER | 4.19% |
|---|---|
| Management Fee | 2.15% |
| Load | Back Fee Only |
| FE Max | 5.00% |
| DSC Max | - |
| Trailer Fee Max (FE) | 1.00% |
| Trailer Fee Max (DSC) | - |
| Trailer Fee Max (NL) | - |
| Trailer Fee Max (LL) | - |
Try Fund Library Premium
For Free with a 30 day trial!
 Fund Library