Try Fund Library Premium
For Free with a 30 day trial!
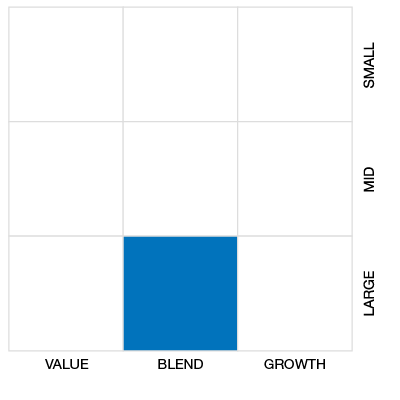
Canadian Fix Inc Balanced
 Click for more information on Fundata’s FundGrade
Click for more information on Fundata’s FundGrade.

2016, 2015, 2014
Click for more information on Fundata’s FundGrade
|
NAVPS (06-13-2025) |
$16.01 |
|---|---|
| Change |
-$0.06
(-0.40%)
|
As at May 31, 2025
As at March 31, 2025
Inception Return (May 25, 2005): 6.20%
| Row Heading | Return | Annualized Return | ||||||||||||
|---|---|---|---|---|---|---|---|---|---|---|---|---|---|---|
| 1 Mth | 3 Mth | 6 Mth | YTD | 1 Yr | 2 Yr | 3 Yr | 4 Yr | 5 Yr | 6 Yr | 7 Yr | 8 Yr | 9 Yr | 10 Yr | |
| Fund | 0.48% | -0.35% | 1.74% | 2.71% | 10.05% | 7.64% | 5.40% | 3.41% | 3.83% | 3.79% | 4.08% | 3.41% | 3.53% | 3.38% |
| Benchmark | 1.45% | 0.24% | 1.49% | 2.73% | 11.95% | 8.28% | 5.45% | 2.91% | 3.57% | 3.79% | 4.13% | 3.76% | 3.93% | 3.66% |
| Category Average | 1.50% | -0.63% | 0.68% | 1.76% | 8.31% | 7.53% | 5.01% | 2.42% | 3.40% | 3.28% | 3.34% | 2.95% | 3.23% | 2.91% |
| Category Rank | 393 / 396 | 147 / 395 | 44 / 395 | 36 / 395 | 54 / 393 | 217 / 390 | 191 / 386 | 99 / 368 | 155 / 335 | 130 / 323 | 93 / 287 | 110 / 272 | 130 / 257 | 98 / 236 |
| Quartile Ranking | 4 | 2 | 1 | 1 | 1 | 3 | 2 | 2 | 2 | 2 | 2 | 2 | 3 | 2 |
| Return % | Jun | Jul | Aug | Sep | Oct | Nov | Dec | Jan | Feb | Mar | Apr | May |
|---|---|---|---|---|---|---|---|---|---|---|---|---|
| Fund | 0.53% | 3.53% | 0.31% | 2.44% | -0.33% | 1.47% | -0.95% | 1.78% | 1.28% | 0.28% | -1.11% | 0.48% |
| Benchmark | 1.88% | 3.07% | 0.70% | 2.15% | -0.59% | 2.72% | -1.20% | 1.71% | 0.76% | -0.59% | -0.60% | 1.45% |
6.98% (May 2009)
-10.36% (October 2008)
| Return % | 2015 | 2016 | 2017 | 2018 | 2019 | 2020 | 2021 | 2022 | 2023 | 2024 |
|---|---|---|---|---|---|---|---|---|---|---|
| Fund | 4.34% | 3.92% | 1.34% | 0.49% | 7.89% | 6.67% | 4.71% | -7.09% | 5.05% | 9.23% |
| Benchmark | 0.56% | 6.19% | 4.30% | -1.25% | 10.87% | 8.35% | 3.73% | -9.93% | 7.79% | 8.33% |
| Category Average | 1.24% | 4.06% | 3.92% | -2.19% | 9.07% | 6.42% | 3.91% | -9.95% | 7.21% | 8.35% |
| Quartile Ranking | 1 | 3 | 4 | 1 | 4 | 3 | 2 | 1 | 4 | 2 |
| Category Rank | 31/ 236 | 157/ 246 | 266/ 269 | 16/ 282 | 246/ 303 | 203/ 333 | 140/ 356 | 26/ 370 | 383/ 388 | 140/ 392 |
9.23% (2024)
-7.09% (2022)
| Name | Percent |
|---|---|
| Canadian Government Bonds | 27.77 |
| Canadian Corporate Bonds | 17.16 |
| Canadian Equity | 16.18 |
| International Equity | 7.81 |
| Foreign Government Bonds | 5.98 |
| Other | 25.10 |
| Name | Percent |
|---|---|
| Fixed Income | 59.93 |
| Consumer Goods | 6.29 |
| Utilities | 4.50 |
| Exchange Traded Fund | 4.16 |
| Cash and Cash Equivalent | 3.92 |
| Other | 21.20 |
| Name | Percent |
|---|---|
| North America | 78.43 |
| Europe | 6.21 |
| Asia | 4.64 |
| Latin America | 2.83 |
| Multi-National | 2.66 |
| Other | 5.23 |
| Name | Percent |
|---|---|
| Fidelity American High Yield Currency Neut Fd B | - |
| iShares Gold Trust ETF (IAU) | - |
| Investment Grade CMBS Securities Directly Held | - |
| Fidelity Canadian Money Market Investment Trust O | - |
| High Yield Investments Directly Held | - |
| iShares 20 Plus Year Treasury Bond ETF (TLT) | - |
| TC Energy Corp | - |
| BCE Inc | - |
| Fortis Inc | - |
| Rogers Communications Inc Cl B | - |

Fidelity Income Allocation Fund Series B
Median
Other - Canadian Fix Inc Balanced
| Standard Deviation | 5.92% | 5.55% | 5.28% |
|---|---|---|---|
| Beta | 0.75% | 0.78% | 0.83% |
| Alpha | 0.01% | 0.01% | 0.00% |
| Rsquared | 0.90% | 0.90% | 0.89% |
| Sharpe | 0.25% | 0.26% | 0.33% |
| Sortino | 0.66% | 0.25% | 0.13% |
| Treynor | 0.02% | 0.02% | 0.02% |
| Tax Efficiency | 77.08% | 68.89% | 70.17% |
| Volatility |

|
|

|

| Key Ratio | 1 Yr | 3 Yr | 5 Yr | 10 Yr |
|---|---|---|---|---|
| Standard Deviation | 4.72% | 5.92% | 5.55% | 5.28% |
| Beta | 0.82% | 0.75% | 0.78% | 0.83% |
| Alpha | 0.00% | 0.01% | 0.01% | 0.00% |
| Rsquared | 0.75% | 0.90% | 0.90% | 0.89% |
| Sharpe | 1.31% | 0.25% | 0.26% | 0.33% |
| Sortino | 3.53% | 0.66% | 0.25% | 0.13% |
| Treynor | 0.08% | 0.02% | 0.02% | 0.02% |
| Tax Efficiency | 90.74% | 77.08% | 68.89% | 70.17% |
| Start Date | May 25, 2005 |
|---|---|
| Instrument Type | Mutual Fund |
| Share Class | Commission Based Advice |
| Legal Status | Trust |
| Sales Status | Open |
| Currency | CAD |
| Distribution Frequency | Monthly |
| Assets ($mil) | $1,170 |
| FundServ Code | Load Code | Sales Status |
|---|---|---|
| FID294 |
The Fund aims to achieve a high total investment return. It invests primarily in investment grade fixed income securities, higher yielding lower quality fixed income securities, equity securities of companies that pay dividends or are expected to pay dividends, and other securities that are expected to distribute income. The Fund can invest in these securities either directly or indirectly through investments in underlying funds.
To meet the Fund’s objectives, the portfolio management team: Follows a neutral mix guideline of approximately 30% equity securities and 70% fixed income securities. May vary the asset mix from the neutral mix if it believes this produces the best overall balance of risk and return. Generally keeps the Fund’s asset mix within the following ranges: 0%-50% equity securities and 50%-100% fixed income securities.
| Portfolio Manager |
Fidelity Investments Canada ULC |
|---|---|
| Sub-Advisor |
Fidelity Management & Research Company LLC |
| Fund Manager |
Fidelity Investments Canada ULC |
|---|---|
| Custodian |
CIBC Mellon Trust Company State Street Trust Company Canada |
| Registrar |
Fidelity Investments Canada ULC |
| Distributor |
Fidelity Investments Canada ULC |
| RSP Eligible | Yes |
|---|---|
| PAC Allowed | Yes |
| PAC Initial Investment | 25 |
| PAC Subsequent | 25 |
| SWP Allowed | Yes |
| SWP Min Balance | 5,000 |
| SWP Min Withdrawal | 50 |
| MER | 1.74% |
|---|---|
| Management Fee | 1.40% |
| Load | Back Fee Only |
| FE Max | 5.00% |
| DSC Max | - |
| Trailer Fee Max (FE) | 0.75% |
| Trailer Fee Max (DSC) | - |
| Trailer Fee Max (NL) | - |
| Trailer Fee Max (LL) | - |
Try Fund Library Premium
For Free with a 30 day trial!
 Fund Library