Try Fund Library Premium
For Free with a 30 day trial!
Sector Equity
|
NAVPS (06-10-2025) |
$7.79 |
|---|---|
| Change |
-$0.06
(-0.71%)
|
As at May 31, 2025
As at May 31, 2025
Inception Return (April 11, 2017): -2.24%
| Row Heading | Return | Annualized Return | ||||||||||||
|---|---|---|---|---|---|---|---|---|---|---|---|---|---|---|
| 1 Mth | 3 Mth | 6 Mth | YTD | 1 Yr | 2 Yr | 3 Yr | 4 Yr | 5 Yr | 6 Yr | 7 Yr | 8 Yr | 9 Yr | 10 Yr | |
| Fund | -4.85% | -11.72% | -18.84% | -14.18% | -33.46% | -12.79% | -17.62% | -22.90% | -11.61% | -13.70% | -7.87% | -1.66% | - | - |
| Benchmark | 5.56% | 3.87% | 3.54% | 7.05% | 21.05% | 19.29% | 11.55% | 10.63% | 14.92% | 11.89% | 10.58% | 10.22% | 10.45% | 8.99% |
| Category Average | 7.08% | -1.54% | -1.34% | -0.12% | 9.75% | 15.00% | 12.73% | 5.79% | 10.22% | 11.32% | 10.39% | 10.40% | 11.44% | 10.10% |
| Category Rank | - | - | - | - | - | - | - | - | - | - | - | - | - | - |
| Quartile Ranking | - | - | - | - | - | - | - | - | - | - | - | - | - | - |
| Return % | Jun | Jul | Aug | Sep | Oct | Nov | Dec | Jan | Feb | Mar | Apr | May |
|---|---|---|---|---|---|---|---|---|---|---|---|---|
| Fund | -2.29% | 1.31% | -8.81% | 6.29% | -2.50% | -12.36% | -5.42% | -2.22% | -0.58% | -8.85% | 1.79% | -4.85% |
| Benchmark | -1.42% | 5.87% | 1.22% | 3.15% | 0.85% | 6.37% | -3.27% | 3.48% | -0.40% | -1.51% | -0.10% | 5.56% |
23.11% (August 2018)
-16.39% (May 2024)
| Return % | 2015 | 2016 | 2017 | 2018 | 2019 | 2020 | 2021 | 2022 | 2023 | 2024 |
|---|---|---|---|---|---|---|---|---|---|---|
| Fund | - | - | - | 16.79% | -6.72% | 37.72% | -6.06% | -37.61% | -6.09% | -16.65% |
| Benchmark | -8.32% | 21.08% | 9.10% | -8.89% | 22.88% | 5.60% | 25.09% | -5.84% | 11.75% | 21.65% |
| Category Average | 16.21% | -0.43% | 20.39% | 1.55% | 22.37% | 29.99% | 15.34% | -25.24% | 26.53% | 20.41% |
| Quartile Ranking | - | - | - | - | - | - | - | - | - | - |
| Category Rank | - | - | - | - | - | - | - | - | - | - |
37.72% (2020)
-37.61% (2022)
| Name | Percent |
|---|---|
| US Equity | 63.96 |
| Cash and Equivalents | 19.71 |
| Canadian Equity | 16.22 |
| Derivatives | 0.11 |
| Name | Percent |
|---|---|
| Healthcare | 41.28 |
| Consumer Services | 23.41 |
| Cash and Cash Equivalent | 19.70 |
| Consumer Goods | 6.80 |
| Technology | 6.45 |
| Other | 2.36 |
| Name | Percent |
|---|---|
| North America | 100.00 |
| Name | Percent |
|---|---|
| Costco Wholesale Corp | 15.39 |
| Green Thumb Industries Inc | 15.10 |
| United States Dollar | 12.85 |
| Icanic Brands Co Inc. Debenture | 6.11 |
| Walmart Inc | 5.01 |
| Cronos Group Inc | 4.05 |
| Microsoft Corp | 3.90 |
| Johnson & Johnson | 3.87 |
| Procter & Gamble Co | 3.86 |
| Glass House Brands Inc Cl A | 3.70 |
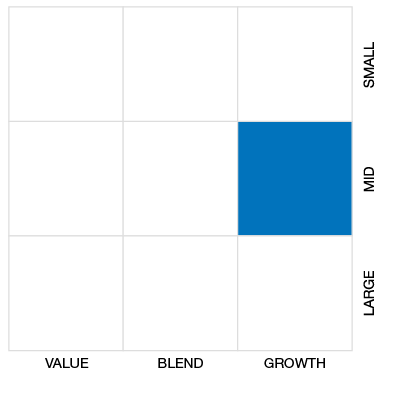

Ninepoint Cannabis and Alternative Health Fund Series A
Median
Other - Sector Equity
| Standard Deviation | 24.19% | 25.05% | - |
|---|---|---|---|
| Beta | 0.53% | 0.74% | - |
| Alpha | -0.23% | -0.20% | - |
| Rsquared | 0.09% | 0.14% | - |
| Sharpe | -0.84% | -0.47% | - |
| Sortino | -0.95% | -0.65% | - |
| Treynor | -0.38% | -0.16% | - |
| Tax Efficiency | - | - | - |
| Volatility |

|
|
- |

| Key Ratio | 1 Yr | 3 Yr | 5 Yr | 10 Yr |
|---|---|---|---|---|
| Standard Deviation | 18.07% | 24.19% | 25.05% | - |
| Beta | -0.01% | 0.53% | 0.74% | - |
| Alpha | -0.38% | -0.23% | -0.20% | - |
| Rsquared | 0.00% | 0.09% | 0.14% | - |
| Sharpe | -2.33% | -0.84% | -0.47% | - |
| Sortino | -2.07% | -0.95% | -0.65% | - |
| Treynor | 53.82% | -0.38% | -0.16% | - |
| Tax Efficiency | - | - | - | - |
| Start Date | April 11, 2017 |
|---|---|
| Instrument Type | Mutual Fund |
| Share Class | Do-It-Yourself |
| Legal Status | Trust |
| Sales Status | Open |
| Currency | CAD |
| Distribution Frequency | Annual |
| Assets ($mil) | - |
| FundServ Code | Load Code | Sales Status |
|---|---|---|
| NPP5420 |
The Fund’s objective is to achieve growth by investing primarily in equity securities of companies engaged in nutrition, nutraceuticals and new forms of medicines and pharmaceutical solutions.
The Fund will primarily invest in a portfolio of companies that are listed on North American exchanges that have a business strategy focused on new and alternative health and wellness related themes that are growing in acceptance and importance in North America.
| Portfolio Manager |
Ninepoint Partners LP |
|---|---|
| Sub-Advisor |
Faircourt Asset Management Inc.
|
| Fund Manager |
Ninepoint Partners LP |
|---|---|
| Custodian |
CIBC Mellon Trust Company |
| Registrar |
CIBC Mellon Global Securities Services Company |
| Distributor |
- |
| RSP Eligible | Yes |
|---|---|
| PAC Allowed | Yes |
| PAC Initial Investment | 1,000 |
| PAC Subsequent | 100 |
| SWP Allowed | Yes |
| SWP Min Balance | 0 |
| SWP Min Withdrawal | 0 |
| MER | 3.67% |
|---|---|
| Management Fee | 2.25% |
| Load | Back Fee Only |
| FE Max | 5.00% |
| DSC Max | - |
| Trailer Fee Max (FE) | 1.00% |
| Trailer Fee Max (DSC) | - |
| Trailer Fee Max (NL) | - |
| Trailer Fee Max (LL) | - |
Try Fund Library Premium
For Free with a 30 day trial!
 Fund Library