Try Fund Library Premium
For Free with a 30 day trial!
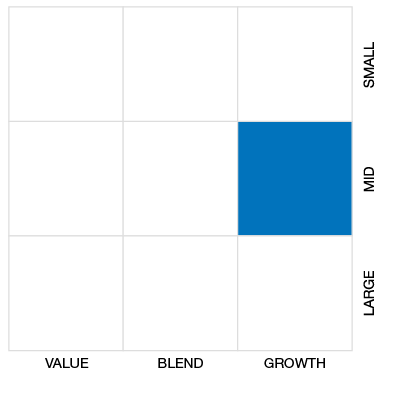
Global Small/Mid Cap Eq
 Click for more information on Fundata’s FundGrade
Click for more information on Fundata’s FundGrade.

2017
Click for more information on Fundata’s FundGrade
|
NAVPS (06-13-2025) |
$15.84 |
|---|---|
| Change |
-$0.23
(-1.43%)
|
As at May 31, 2025
As at May 31, 2025
Inception Return (July 29, 2014): 6.39%
| Row Heading | Return | Annualized Return | ||||||||||||
|---|---|---|---|---|---|---|---|---|---|---|---|---|---|---|
| 1 Mth | 3 Mth | 6 Mth | YTD | 1 Yr | 2 Yr | 3 Yr | 4 Yr | 5 Yr | 6 Yr | 7 Yr | 8 Yr | 9 Yr | 10 Yr | |
| Fund | 5.82% | 3.39% | -2.59% | -0.09% | 12.58% | 13.35% | 9.64% | -0.39% | 6.42% | 3.65% | 3.13% | 3.20% | 5.71% | 4.87% |
| Benchmark | 5.68% | -1.75% | -4.06% | -1.05% | 9.42% | 14.83% | 10.76% | 5.74% | 10.79% | 8.77% | 6.88% | 7.29% | 8.61% | 7.52% |
| Category Average | 5.70% | 0.86% | -0.91% | 1.66% | 6.63% | 11.23% | 8.33% | 2.85% | 8.85% | 7.08% | 4.89% | 5.05% | 6.09% | 4.95% |
| Category Rank | 87 / 281 | 88 / 281 | 161 / 278 | 171 / 279 | 58 / 269 | 101 / 258 | 104 / 233 | 173 / 222 | 155 / 193 | 157 / 171 | 125 / 145 | 120 / 134 | 103 / 127 | 93 / 113 |
| Quartile Ranking | 2 | 2 | 3 | 3 | 1 | 2 | 2 | 4 | 4 | 4 | 4 | 4 | 4 | 4 |
| Return % | Jun | Jul | Aug | Sep | Oct | Nov | Dec | Jan | Feb | Mar | Apr | May |
|---|---|---|---|---|---|---|---|---|---|---|---|---|
| Fund | -1.58% | 6.70% | -1.45% | 2.53% | 1.69% | 7.12% | -2.50% | 2.73% | -5.93% | -2.75% | 0.47% | 5.82% |
| Benchmark | -1.02% | 5.44% | -1.29% | 3.07% | 0.86% | 6.51% | -3.05% | 4.42% | -3.55% | -4.14% | -3.02% | 5.68% |
17.23% (April 2020)
-17.89% (March 2020)
| Return % | 2015 | 2016 | 2017 | 2018 | 2019 | 2020 | 2021 | 2022 | 2023 | 2024 |
|---|---|---|---|---|---|---|---|---|---|---|
| Fund | 7.67% | 18.49% | 13.52% | -9.47% | 2.61% | 28.48% | 12.20% | -33.48% | 20.24% | 16.67% |
| Benchmark | 16.61% | 7.47% | 15.40% | -7.34% | 20.09% | 11.07% | 15.50% | -13.14% | 14.59% | 18.68% |
| Category Average | 9.56% | 3.48% | 12.62% | -10.42% | 13.76% | 14.53% | 12.37% | -15.59% | 12.82% | 12.04% |
| Quartile Ranking | 4 | 1 | 3 | 3 | 4 | 2 | 3 | 4 | 1 | 2 |
| Category Rank | 82/ 101 | 17/ 127 | 71/ 132 | 84/ 142 | 161/ 168 | 58/ 174 | 140/ 209 | 225/ 231 | 49/ 248 | 84/ 266 |
28.48% (2020)
-33.48% (2022)
| Name | Percent |
|---|---|
| International Equity | 46.11 |
| US Equity | 43.77 |
| Canadian Equity | 7.91 |
| Income Trust Units | 2.16 |
| Cash and Equivalents | 0.05 |
| Name | Percent |
|---|---|
| Technology | 18.79 |
| Real Estate | 15.43 |
| Industrial Goods | 13.85 |
| Consumer Services | 12.15 |
| Financial Services | 9.09 |
| Other | 30.69 |
| Name | Percent |
|---|---|
| North America | 51.67 |
| Europe | 44.60 |
| Latin America | 2.16 |
| Asia | 0.83 |
| Other | 0.74 |
| Name | Percent |
|---|---|
| CACI International Inc Cl A | 3.80 |
| Construction Partners Inc Cl A | 3.75 |
| CSW Industrials Inc | 3.50 |
| Live Nation Entertainment Inc | 3.29 |
| Dalata Hotel Group PLC | 3.10 |
| Burford Capital Ltd | 3.01 |
| Glenveagh Properties PLC | 2.94 |
| Wise PLC Cl A | 2.92 |
| Lamar Advertising Co Cl A | 2.81 |
| SOL SpA | 2.72 |

CI Global Small/Mid Cap Equity Corporate Class Series A
Median
Other - Global Small/Mid Cap Eq
| Standard Deviation | 17.47% | 18.27% | 17.75% |
|---|---|---|---|
| Beta | 1.08% | 1.17% | 1.12% |
| Alpha | -0.02% | -0.05% | -0.03% |
| Rsquared | 0.90% | 0.83% | 0.82% |
| Sharpe | 0.39% | 0.30% | 0.26% |
| Sortino | 0.72% | 0.40% | 0.28% |
| Treynor | 0.06% | 0.05% | 0.04% |
| Tax Efficiency | 97.98% | 93.83% | - |
| Volatility |

|

|
|

| Key Ratio | 1 Yr | 3 Yr | 5 Yr | 10 Yr |
|---|---|---|---|---|
| Standard Deviation | 14.26% | 17.47% | 18.27% | 17.75% |
| Beta | 0.96% | 1.08% | 1.17% | 1.12% |
| Alpha | 0.03% | -0.02% | -0.05% | -0.03% |
| Rsquared | 0.86% | 0.90% | 0.83% | 0.82% |
| Sharpe | 0.65% | 0.39% | 0.30% | 0.26% |
| Sortino | 1.26% | 0.72% | 0.40% | 0.28% |
| Treynor | 0.10% | 0.06% | 0.05% | 0.04% |
| Tax Efficiency | 95.62% | 97.98% | 93.83% | - |
| Start Date | July 29, 2014 |
|---|---|
| Instrument Type | Mutual Fund |
| Share Class | Commission Based Advice |
| Legal Status | Corporation |
| Sales Status | Open |
| Currency | CAD |
| Distribution Frequency | Quarterly |
| Assets ($mil) | $385 |
| FundServ Code | Load Code | Sales Status |
|---|---|---|
| CIG14282 | ||
| CIG1594 | ||
| CIG2594 | ||
| CIG3594 |
The investment objective of the fund is to provide long-term capital growth by investing primarily in common shares of companies located anywhere in the world. Any change to the fundamental investment objective must be approved by a majority of votes cast at a meeting of securityholders held for that reason.
When buying and selling securities for the fund, the portfolio adviser examines each company’s potential for success in light of its current financial condition, its industry position and economic and market conditions. The portfolio adviser considers factors like growth potential, earnings estimates and quality of management. The portfolio adviser may use techniques such as fundamental analysis to assess growth potential and valuation.
| Portfolio Manager |
CI Global Asset Management
|
|---|---|
| Sub-Advisor |
- |
| Fund Manager |
CI Global Asset Management |
|---|---|
| Custodian |
CIBC Mellon Trust Company |
| Registrar |
CI Global Asset Management |
| Distributor |
- |
| RSP Eligible | Yes |
|---|---|
| PAC Allowed | Yes |
| PAC Initial Investment | 50 |
| PAC Subsequent | 50 |
| SWP Allowed | Yes |
| SWP Min Balance | 5,000 |
| SWP Min Withdrawal | 50 |
| MER | 2.43% |
|---|---|
| Management Fee | 2.00% |
| Load | Choice of Front or No Load |
| FE Max | 5.00% |
| DSC Max | - |
| Trailer Fee Max (FE) | 1.00% |
| Trailer Fee Max (DSC) | 0.50% |
| Trailer Fee Max (NL) | - |
| Trailer Fee Max (LL) | - |
Try Fund Library Premium
For Free with a 30 day trial!
 Fund Library