Join Fund Library now and get free access to personalized features to help you manage your investments.
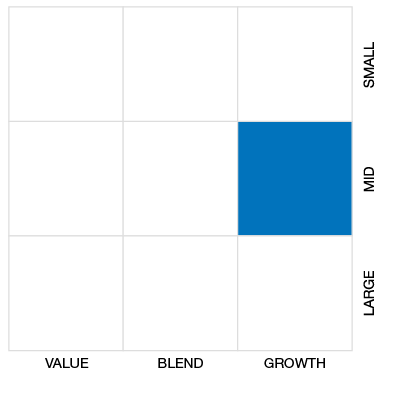
Global Equity Balanced
 Click for more information on Fundata’s FundGrade
Click for more information on Fundata’s FundGrade.
 Click for more information on Fundata’s ESG Grade
Click for more information on Fundata’s ESG Grade.

2021, 2020, 2019, 2018, 2017
Click for more information on Fundata’s FundGrade
|
NAVPS (05-15-2024) |
$14.43 |
|---|---|
| Change |
$0.10
(0.71%)
|
As at April 30, 2024
As at March 31, 2024
As at February 29, 2024
Inception Return (August 23, 2011): 8.43%
| Row Heading | Return | Annualized Return | ||||||||||||
|---|---|---|---|---|---|---|---|---|---|---|---|---|---|---|
| 1 Mth | 3 Mth | 6 Mth | YTD | 1 Yr | 2 Yr | 3 Yr | 4 Yr | 5 Yr | 6 Yr | 7 Yr | 8 Yr | 9 Yr | 10 Yr | |
| Fund | -3.61% | -1.01% | 7.56% | -1.56% | 1.51% | 3.26% | -2.97% | 2.88% | 2.20% | 3.05% | 3.51% | 5.00% | 4.93% | 5.84% |
| Benchmark | -1.69% | 4.83% | 14.69% | 5.94% | 13.39% | 10.26% | 5.25% | 8.59% | 7.10% | 7.38% | 7.04% | 8.68% | 7.83% | 8.60% |
| Category Average | -1.93% | 13.42% | 13.42% | 4.49% | 9.56% | 6.61% | 3.35% | 7.70% | 5.33% | 5.29% | 4.93% | 5.96% | 4.97% | 5.41% |
| Category Rank | 1,363 / 1,364 | 1,362 / 1,363 | 1,350 / 1,356 | 1,362 / 1,363 | 1,272 / 1,294 | 1,211 / 1,268 | 1,120 / 1,122 | 1,036 / 1,065 | 1,008 / 1,041 | 861 / 903 | 723 / 818 | 636 / 774 | 391 / 625 | 303 / 552 |
| Quartile Ranking | 4 | 4 | 4 | 4 | 4 | 4 | 4 | 4 | 4 | 4 | 4 | 4 | 3 | 3 |
| Return % | May | Jun | Jul | Aug | Sep | Oct | Nov | Dec | Jan | Feb | Mar | Apr |
|---|---|---|---|---|---|---|---|---|---|---|---|---|
| Fund | -3.55% | 1.07% | 1.74% | 0.98% | -3.96% | -1.89% | 5.68% | 3.39% | -0.55% | 1.83% | 0.84% | -3.61% |
| Benchmark | -1.16% | 1.58% | 2.43% | 0.23% | -3.90% | -0.20% | 5.87% | 2.26% | 1.06% | 4.23% | 2.30% | -1.69% |
7.00% (January 2015)
-7.67% (March 2020)
| Return % | 2014 | 2015 | 2016 | 2017 | 2018 | 2019 | 2020 | 2021 | 2022 | 2023 |
|---|---|---|---|---|---|---|---|---|---|---|
| Fund | 8.81% | 21.66% | -0.36% | 15.71% | -3.03% | 18.17% | 12.74% | 2.32% | -16.08% | 10.59% |
| Benchmark | 13.13% | 17.03% | 3.66% | 11.99% | 0.72% | 16.29% | 12.17% | 11.33% | -12.03% | 15.07% |
| Category Average | 7.89% | 4.87% | 4.92% | 9.31% | -5.49% | 15.12% | 8.09% | 12.42% | -11.85% | 11.42% |
| Quartile Ranking | 3 | 1 | 4 | 1 | 2 | 1 | 1 | 4 | 4 | 3 |
| Category Rank | 283/ 538 | 18/ 611 | 694/ 712 | 16/ 805 | 250/ 885 | 124/ 969 | 186/ 1,063 | 1,088/ 1,111 | 1,097/ 1,229 | 793/ 1,280 |
21.66% (2015)
-16.08% (2022)
| Name | Percent |
|---|---|
| International Equity | 50.29 |
| US Equity | 16.89 |
| Foreign Corporate Bonds | 10.64 |
| Cash and Equivalents | 9.39 |
| Foreign Government Bonds | 8.91 |
| Other | 3.88 |
| Name | Percent |
|---|---|
| Fixed Income | 23.32 |
| Industrial Services | 16.52 |
| Technology | 13.99 |
| Consumer Goods | 13.50 |
| Healthcare | 10.03 |
| Other | 22.64 |
| Name | Percent |
|---|---|
| Europe | 45.19 |
| North America | 43.03 |
| Asia | 8.27 |
| Latin America | 3.37 |
| Africa and Middle East | 0.11 |
| Other | 0.03 |
| Name | Percent |
|---|---|
| Manulife Global Small Cap Fund Advisor Series | - |
| Manulife Strategic Income Fund Advisor Ser | - |
| Canadian Dollar | - |
| Manulife Canadian Bond Fund Advisor Series | - |
| Cash and Cash equivalents | - |

Manulife Global Small Cap Balanced Fund Advisor Series
Median
Other - Global Equity Balanced
| Standard Deviation | 10.69% | 10.94% | 9.60% |
|---|---|---|---|
| Beta | 0.90% | 0.97% | 0.93% |
| Alpha | -0.08% | -0.04% | -0.02% |
| Rsquared | 0.81% | 0.82% | 0.81% |
| Sharpe | -0.49% | 0.07% | 0.49% |
| Sortino | -0.64% | -0.03% | 0.48% |
| Treynor | -0.06% | 0.01% | 0.05% |
| Tax Efficiency | - | 45.47% | 68.52% |
| Volatility |

|

|
|

| Key Ratio | 1 Yr | 3 Yr | 5 Yr | 10 Yr |
|---|---|---|---|---|
| Standard Deviation | 10.33% | 10.69% | 10.94% | 9.60% |
| Beta | 1.03% | 0.90% | 0.97% | 0.93% |
| Alpha | -0.11% | -0.08% | -0.04% | -0.02% |
| Rsquared | 0.85% | 0.81% | 0.82% | 0.81% |
| Sharpe | -0.27% | -0.49% | 0.07% | 0.49% |
| Sortino | -0.14% | -0.64% | -0.03% | 0.48% |
| Treynor | -0.03% | -0.06% | 0.01% | 0.05% |
| Tax Efficiency | 85.54% | - | 45.47% | 68.52% |
The E, S, and G scores are averaged for each security in the portfolio, to arrive at an ESG score for each security. We take the portfolio weighted average of the ESG scores for each fund and rank them against their peers to arrive at the Fundata ESG Score from 0-100.
Three scores under the Environment bucket are averaged to yield the Fundata Environment Score for each fund from 0-100: (1) Pollution Prevention, (2) Environmental Transparency, (3) Resource Efficiency.
Six scores under the Social bucket are averaged to yield the Fundata Social Score for each fund from 0-100. (1) Compensation and Satisfaction, (2) Diversity and Rights, (3) Education and Work Conditions, (4) Community and Charity, (5) Human Rights, (6) Sustainability Integration.
Three scores under the governance bucket are averaged to yield the Fundata Governance Score for each fund from 0-100: (1) Board Effectiveness, (2) Management Ethics, (3) Disclosure and Accountability.
Powered by OWL Analytics. For more information, please contact Fundata Canada.
| Start Date | August 23, 2011 |
|---|---|
| Instrument Type | Mutual Fund |
| Share Class | Commission Based Advice |
| Legal Status | Trust |
| Sales Status | Capped |
| Currency | CAD |
| Distribution Frequency | Annual |
| Assets ($mil) | $17 |
| FundServ Code | Load Code | Sales Status |
|---|---|---|
| MMF14418 | ||
| MMF4218 | ||
| MMF4318 | ||
| MMF4418 | ||
| MMF4518 | ||
| MMF4718 |
The fundamental investment objective of the Fund is to provide long-term capital growth and income by investing primarily in equity securities of global small-cap companies and government and corporate debt securities from developed and emerging markets. The Fund may also invest in U.S. government and agency securities, high yield bonds and preferred shares and other types of debt securities. The Fund may seek to accomplish its objective by investing in securities of other mutual funds.
The Fund will normally invest between 65–85% of its assets in equity securities and the balance in fixed income or money market securities. The equity component of the Fund, to be invested by the portfolio sub-advisor, will be invested primarily in small-cap companies from around the world.
| Name | Start Date |
|---|---|
| Paul Moroz | 08-17-2011 |
| Christian Deckart | 02-20-2020 |
| Manulife Investment Management Limited | 12-10-2020 |
| Fund Manager | Manulife Investment Management Limited |
|---|---|
| Advisor | Manulife Investment Management Limited |
| Custodian | RBC Investor Services Trust (Canada) |
| Registrar | Manulife Investment Management Limited |
| Distributor | - |
| Auditor | Ernst & Young LLP |
| RSP Eligible | Yes |
|---|---|
| PAC Allowed | Yes |
| PAC Initial Investment | 25 |
| PAC Subsequent | 25 |
| SWP Allowed | Yes |
| SWP Min Balance | - |
| SWP Min Withdrawal | - |
| MER | 2.41% |
|---|---|
| Management Fee | 1.99% |
| Load | Choice of Front or No Load |
| FE Max | 5.00% |
| DSC Max | - |
| Trailer Fee Max (FE) | 1.00% |
| Trailer Fee Max (DSC) | - |
| Trailer Fee Max (NL) | - |
| Trailer Fee Max (LL) | - |
Join Fund Library now and get free access to personalized features to help you manage your investments.
 Fund Library