Try Fund Library Premium
For Free with a 30 day trial!
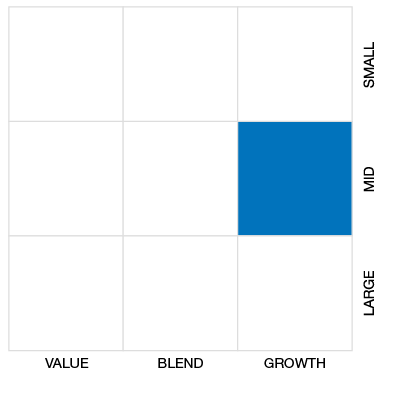
Global Small/Mid Cap Eq
 Click for more information on Fundata’s FundGrade
Click for more information on Fundata’s FundGrade.
|
Close (06-10-2025) |
$31.39 |
|---|---|
| Change |
$0.06
(0.19%)
|
| Open | $31.39 |
|---|---|
| Day Range | $31.39 - $31.39 |
| Volume | 100 |
As at May 31, 2025
As at May 31, 2025
Inception Return (April 28, 2022): 10.81%
| Row Heading | Return | Annualized Return | ||||||||||||
|---|---|---|---|---|---|---|---|---|---|---|---|---|---|---|
| 1 Mth | 3 Mth | 6 Mth | YTD | 1 Yr | 2 Yr | 3 Yr | 4 Yr | 5 Yr | 6 Yr | 7 Yr | 8 Yr | 9 Yr | 10 Yr | |
| Fund | 15.19% | -2.87% | -31.57% | -16.47% | 31.50% | 51.52% | 21.83% | - | - | - | - | - | - | - |
| Benchmark | 5.68% | -1.75% | -4.06% | -1.05% | 9.42% | 14.83% | 10.76% | 5.74% | 10.79% | 8.77% | 6.88% | 7.29% | 8.61% | 7.52% |
| Category Average | 5.71% | -0.90% | -0.90% | 1.67% | 6.64% | 11.24% | 8.33% | 2.85% | 8.86% | 7.08% | 4.89% | 5.05% | 6.09% | 4.95% |
| Category Rank | 1 / 279 | 234 / 279 | 276 / 276 | 277 / 277 | 1 / 267 | 1 / 256 | 7 / 233 | - | - | - | - | - | - | - |
| Quartile Ranking | 1 | 4 | 4 | 4 | 1 | 1 | 1 | - | - | - | - | - | - | - |
| Return % | Jun | Jul | Aug | Sep | Oct | Nov | Dec | Jan | Feb | Mar | Apr | May |
|---|---|---|---|---|---|---|---|---|---|---|---|---|
| Fund | 24.43% | 2.16% | -11.28% | 10.75% | 11.42% | 38.09% | -18.07% | 4.64% | -17.83% | -21.38% | 7.25% | 15.19% |
| Benchmark | -1.02% | 5.44% | -1.29% | 3.07% | 0.86% | 6.51% | -3.05% | 4.42% | -3.55% | -4.14% | -3.02% | 5.68% |
42.92% (July 2022)
-32.69% (June 2022)
| Return % | 2015 | 2016 | 2017 | 2018 | 2019 | 2020 | 2021 | 2022 | 2023 | 2024 |
|---|---|---|---|---|---|---|---|---|---|---|
| Fund | - | - | - | - | - | - | - | - | 138.46% | 78.12% |
| Benchmark | 16.61% | 7.47% | 15.40% | -7.34% | 20.09% | 11.07% | 15.50% | -13.14% | 14.59% | 18.68% |
| Category Average | 9.56% | 3.48% | 12.62% | -10.42% | 13.76% | 14.53% | 12.37% | -15.59% | 12.82% | 12.04% |
| Quartile Ranking | - | - | - | - | - | - | - | - | 1 | 1 |
| Category Rank | - | - | - | - | - | - | - | - | 1/ 248 | 1/ 264 |
138.46% (2023)
78.12% (2024)
| Name | Percent |
|---|---|
| US Equity | 71.25 |
| International Equity | 21.03 |
| Canadian Equity | 7.08 |
| Cash and Equivalents | 0.63 |
| Other | 0.01 |
| Name | Percent |
|---|---|
| Financial Services | 53.80 |
| Technology | 31.73 |
| Healthcare | 8.44 |
| Energy | 4.13 |
| Consumer Goods | 1.26 |
| Other | 0.64 |
| Name | Percent |
|---|---|
| North America | 78.97 |
| Asia | 17.11 |
| Europe | 3.91 |
| Other | 0.01 |
| Name | Percent |
|---|---|
| MicroStrategy Inc Cl A | 5.16 |
| Coinbase Global Inc Cl A | 5.12 |
| Bitdeer Technologies Group Cl A | 4.84 |
| Hut 8 Corp | 4.80 |
| Iris Energy Ltd | 4.58 |
| Core Scientific Inc | 4.53 |
| Semler Scientific Inc | 4.52 |
| Terawulf Inc | 4.35 |
| Marathon Digital Holdings Inc | 4.28 |
| Galaxy Digital Holdings Ltd | 4.14 |

CI Galaxy Blockchain Index ETF Common Units
Median
Other - Global Small/Mid Cap Eq
| Standard Deviation | 72.99% | - | - |
|---|---|---|---|
| Beta | 3.46% | - | - |
| Alpha | 0.05% | - | - |
| Rsquared | 0.53% | - | - |
| Sharpe | 0.56% | - | - |
| Sortino | 1.00% | - | - |
| Treynor | 0.12% | - | - |
| Tax Efficiency | - | - | - |
| Volatility |

|
- | - |
| Key Ratio | 1 Yr | 3 Yr | 5 Yr | 10 Yr |
|---|---|---|---|---|
| Standard Deviation | 63.19% | 72.99% | - | - |
| Beta | 3.09% | 3.46% | - | - |
| Alpha | 0.15% | 0.05% | - | - |
| Rsquared | 0.46% | 0.53% | - | - |
| Sharpe | 0.66% | 0.56% | - | - |
| Sortino | 1.19% | 1.00% | - | - |
| Treynor | 0.14% | 0.12% | - | - |
| Tax Efficiency | 99.69% | - | - | - |
| Start Date | April 28, 2022 |
|---|---|
| Instrument Type | Exchange Traded Fund |
| Share Class | Do-It-Yourself |
| Legal Status | - |
| Sales Status | Open |
| Currency | CAD |
| Distribution Frequency | Quarterly |
| Assets ($mil) | - |
| 52 Week High | $44.97 |
| 52 Week Low | $19.40 |
| Annual Dividend | $0.05 |
| Annual Yield | - |
| Index | - |
| Shares Outstanding | - |
| Registered Plan Eligible | Yes |
| Exposure | - |
|---|---|
| Asset Class High | - |
| Asset Class Medium | - |
| Asset Class Low | - |
| Leveraged | - |
| Inverse | - |
| Advisor Series | - |
| Covered Call Strategy | No |
CBCX seeks to replicate, to the extent reasonably possible, the performance of the Alerian Galaxy Global Cryptocurrency-Focused Blockchain Equity Hedged to CAD Dollars Index (the “Index”), net of expenses. The Index intends to track the performance of companies engaged in the development of blockchain technologies, as well as businesses operating and developing the blockchain ecosystem. The Index hedges foreign currency exposure back to Canadian dollars.
The investment strategy of each Index ETF is to invest in and hold, to the extent reasonably possible, the Constituent Securities of the applicable Index in substantially the same proportion as they are reflected in the applicable Index. With respect to any Index ETF, the Manager may use a sampling strategy in selecting its investments to achieve its objective.
| Portfolio Manager |
CI Global Asset Management
|
|---|---|
| Sub-Advisor |
- |
| Fund Manager |
CI Global Asset Management |
|---|---|
| Custodian |
CIBC Mellon Global Securities Services Company |
| Registrar |
- |
| Distributor |
CI Global Asset Management |
| MER | 0.59% |
|---|---|
| Management Fee | 0.50% |
Try Fund Library Premium
For Free with a 30 day trial!
 Fund Library