Try Fund Library Premium
Free with a 30 day trial!
Gain access to
- Unlimited Watchlists
- Advanced Search Filtering
- Fund Comparisons
- Portfolio Scenarios
- Customizable PDF Reports
- Portfolio Rebalancer new
CI Munro Global Growth Small/Mid Cap Equity Corporate Class Series A
Global Small/Mid Cap Eq
|
NAVPS (11-09-2026) |
$9.57 |
|---|---|
| Change |
$0.27
(2.93%)
|
As at October 31, 2026
As at October 31, 2026
No data available
Fund Returns
Inception Return (September 15, 2026): -4.57%
| Row Heading | Return | Annualized Return | ||||||||||||
|---|---|---|---|---|---|---|---|---|---|---|---|---|---|---|
| 1 Mth | 3 Mth | 6 Mth | YTD | 1 Yr | 2 Yr | 3 Yr | 4 Yr | 5 Yr | 6 Yr | 7 Yr | 8 Yr | 9 Yr | 10 Yr | |
| Fund | -6.45% | - | - | - | - | - | - | - | - | - | - | - | - | - |
| Benchmark | -1.35% | -0.04% | 3.71% | 13.55% | 13.51% | 14.57% | 19.51% | 15.48% | 8.77% | 12.42% | 10.65% | 10.53% | 9.00% | 9.98% |
| Category Average | -0.49% | -2.11% | 2.63% | 8.19% | 8.37% | 10.81% | 15.35% | 12.43% | 5.32% | 9.24% | 8.40% | 7.72% | 6.27% | 7.05% |
| Category Rank | 256 / 265 | - | - | - | - | - | - | - | - | - | - | - | - | - |
| Quartile Ranking | 4 | - | - | - | - | - | - | - | - | - | - | - | - | - |
Monthly Return
| Return % | Nov | Dec | Jan | Feb | Mar | Apr | May | Jun | Jul | Aug | Sep | Oct |
|---|---|---|---|---|---|---|---|---|---|---|---|---|
| Fund | - | - | - | - | - | - | - | - | - | - | - | -6.45% |
| Benchmark | 0.81% | -0.85% | 3.81% | 4.82% | -5.42% | 6.39% | 5.12% | 4.04% | -5.14% | 2.65% | -1.28% | -1.35% |
Best Monthly Return Since Inception
2.01% (September 2026)
Worst Monthly Return Since Inception
-6.45% (October 2026)
Calendar Return (%)
| Return % | 2016 | 2017 | 2018 | 2019 | 2020 | 2021 | 2022 | 2023 | 2024 | 2025 |
|---|---|---|---|---|---|---|---|---|---|---|
| Fund | - | - | - | - | - | - | - | - | - | - |
| Benchmark | 7.47% | 15.40% | -7.34% | 20.09% | 11.07% | 15.50% | -13.14% | 14.59% | 18.68% | 11.95% |
| Category Average | 3.48% | 12.62% | -10.42% | 13.76% | 14.53% | 12.37% | -15.59% | 12.82% | 12.04% | 12.29% |
| Quartile Ranking | - | - | - | - | - | - | - | - | - | - |
| Category Rank | - | - | - | - | - | - | - | - | - | - |
Best Calendar Return (Last 10 years)
-
Worst Calendar Return (Last 10 years)
-
Asset Allocation
| Name | Percent |
|---|---|
| US Equity | 77.30 |
| International Equity | 12.58 |
| Cash and Equivalents | 7.80 |
| Income Trust Units | 2.31 |
| Other | 0.01 |
Sector Allocation
| Name | Percent |
|---|---|
| Technology | 21.06 |
| Industrial Goods | 18.12 |
| Healthcare | 11.43 |
| Consumer Services | 9.32 |
| Energy | 9.15 |
| Other | 30.92 |
Geographic Allocation
| Name | Percent |
|---|---|
| North America | 82.90 |
| Europe | 5.59 |
| Latin America | 4.64 |
| Asia | 3.78 |
| Africa and Middle East | 3.08 |
| Other | 0.01 |
Top Holdings
| Name | Percent |
|---|---|
| Targa Resources Corp | 9.15 |
| Cash | 8.06 |
| TKO Group Holdings Inc Cl A | 7.29 |
| Leonardo DRS Inc | 6.25 |
| Lumentum Holdings Inc | 6.04 |
| NiSource Inc | 4.43 |
| IQVIA Holdings Inc | 4.18 |
| Liberty Media Corp Sr A | 4.03 |
| HEICO Corp | 3.74 |
| Interactive Brokers Group Inc Cl A | 3.52 |
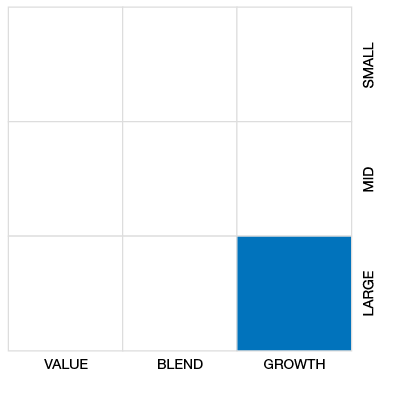
Equity Style
Fixed Income Style

Risk vs Return (3 Yr)
3 Yr Annualized
| Standard Deviation | - | - | - |
|---|---|---|---|
| Beta | - | - | - |
| Alpha | - | - | - |
| Rsquared | - | - | - |
| Sharpe | - | - | - |
| Sortino | - | - | - |
| Treynor | - | - | - |
| Tax Efficiency | - | - | - |
| Volatility | - | - | - |
Risk Rating

Annualized Key Ratio Period Comparison
| Key Ratio | 1 Yr | 3 Yr | 5 Yr | 10 Yr |
|---|---|---|---|---|
| Standard Deviation | - | - | - | - |
| Beta | - | - | - | - |
| Alpha | - | - | - | - |
| Rsquared | - | - | - | - |
| Sharpe | - | - | - | - |
| Sortino | - | - | - | - |
| Treynor | - | - | - | - |
| Tax Efficiency | - | - | - | - |
Fund Details
| Start Date | September 15, 2026 |
|---|---|
| Instrument Type | Mutual Fund |
| Share Class | Commission Based Advice |
| Legal Status | Corporation |
| Sales Status | Open |
| Currency | CAD |
| Distribution Frequency | Quarterly |
| Assets ($mil) | $1 |
Fund Codes
| FundServ Code | Load Code | Sales Status |
|---|---|---|
| CIG2049 | ISC | Open |
| CIG3099 | DSC | Open |
Investment Objectives
The fund seeks to maximize long-term capital appreciation primarily through exposure in a portfolio of growth oriented small and medium capitalization companies located anywhere in the world.
Investment Strategy
The fund will invest primarily in listed small and medium capitalization companies from around the world. The investment strategy is designed to identify sustainable growth trends that are under-appreciated and mispriced by the market.; The portfolio sub-adviser utilizes its proprietary investment process to generate a focused investment universe and filters these structural growth ideas into a portfolio of high conviction investments.
Portfolio Management
| Portfolio Manager |
CI Global Asset Management |
|---|---|
| Sub-Advisor |
Munro Partners
|
Management and Organization
| Fund Manager |
CI Global Asset Management |
|---|---|
| Custodian |
- |
| Registrar |
- |
| Distributor |
- |
Investment Minimums
| RSP Eligible | Yes |
|---|---|
| PAC Allowed | Yes |
| PAC Initial Investment | - |
| PAC Subsequent | - |
| SWP Allowed | Yes |
| SWP Min Balance | - |
| SWP Min Withdrawal | - |
Fees
| MER | - |
|---|---|
| Management Fee | 1.75% |
| Load | Choice of Front or No Load |
| FE Max | 5.00% |
| DSC Max | - |
| Trailer Fee Max (FE) | 1.00% |
| Trailer Fee Max (DSC) | 0.50% |
| Trailer Fee Max (NL) | - |
| Trailer Fee Max (LL) | - |
Try Fund Library Premium
Free with a 30 day trial!
Gain access to
- Unlimited Watchlists
- Advanced Search Filtering
- Fund Comparisons
- Portfolio Scenarios
- Customizable PDF Reports
- Portfolio Rebalancer new