Join Fund Library now and get free access to personalized features to help you manage your investments.
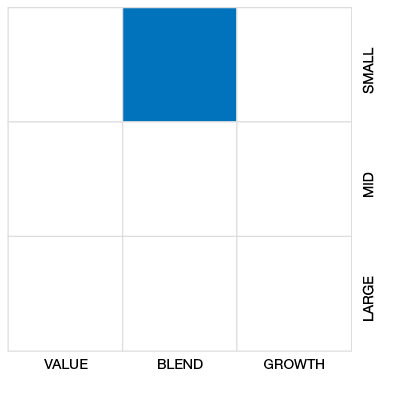
Cdn Small/Mid Cap Equity
 Click for more information on Fundata’s FundGrade
Click for more information on Fundata’s FundGrade.
 Click for more information on Fundata’s ESG Grade
Click for more information on Fundata’s ESG Grade.
|
NAVPS (04-23-2024) |
$19.37 |
|---|---|
| Change |
$0.26
(1.35%)
|
As at March 31, 2024
As at March 31, 2024
As at February 29, 2024
Inception Return (May 14, 2007): 2.25%
| Row Heading | Return | Annualized Return | ||||||||||||
|---|---|---|---|---|---|---|---|---|---|---|---|---|---|---|
| 1 Mth | 3 Mth | 6 Mth | YTD | 1 Yr | 2 Yr | 3 Yr | 4 Yr | 5 Yr | 6 Yr | 7 Yr | 8 Yr | 9 Yr | 10 Yr | |
| Fund | 7.39% | 7.75% | 14.00% | 7.75% | 7.74% | -2.97% | 3.76% | 22.34% | 7.84% | 6.18% | 4.26% | 7.10% | 5.57% | 3.90% |
| Benchmark | 7.49% | 7.92% | 14.37% | 7.92% | 8.22% | -2.72% | 3.99% | 22.48% | 7.82% | 6.15% | 4.23% | 7.10% | 5.60% | 3.95% |
| Category Average | 2.60% | 14.10% | 14.10% | 6.51% | 10.11% | 0.73% | 4.35% | 17.73% | 7.77% | 6.08% | 4.99% | 6.38% | 4.84% | 4.30% |
| Category Rank | 1 / 217 | 85 / 214 | 132 / 213 | 85 / 214 | 153 / 213 | 182 / 211 | 113 / 201 | 33 / 193 | 109 / 185 | 104 / 177 | 116 / 167 | 86 / 165 | 87 / 141 | 109 / 136 |
| Quartile Ranking | 1 | 2 | 3 | 2 | 3 | 4 | 3 | 1 | 3 | 3 | 3 | 3 | 3 | 4 |
| Return % | Apr | May | Jun | Jul | Aug | Sep | Oct | Nov | Dec | Jan | Feb | Mar |
|---|---|---|---|---|---|---|---|---|---|---|---|---|
| Fund | -1.18% | -4.07% | 0.58% | 6.06% | -1.34% | -5.28% | -2.62% | 4.73% | 3.73% | -0.41% | 0.75% | 7.39% |
| Benchmark | -1.16% | -4.06% | 0.59% | 6.09% | -1.31% | -5.24% | -2.58% | 4.84% | 3.76% | -0.37% | 0.77% | 7.49% |
25.22% (April 2020)
-29.15% (March 2020)
| Return % | 2014 | 2015 | 2016 | 2017 | 2018 | 2019 | 2020 | 2021 | 2022 | 2023 |
|---|---|---|---|---|---|---|---|---|---|---|
| Fund | -2.70% | -13.50% | 38.18% | 2.64% | -18.04% | 16.14% | 13.36% | 20.19% | -9.22% | 4.31% |
| Benchmark | -2.34% | -13.31% | 38.48% | 2.75% | -18.17% | 15.84% | 12.87% | 20.27% | -9.29% | 4.79% |
| Category Average | 3.45% | -6.13% | 18.01% | 3.43% | -15.15% | 16.59% | 11.91% | 22.35% | -11.32% | 6.49% |
| Quartile Ranking | 4 | 4 | 1 | 3 | 4 | 4 | 3 | 3 | 2 | 3 |
| Category Rank | 121/ 135 | 135/ 140 | 1/ 162 | 94/ 167 | 138/ 177 | 139/ 184 | 108/ 189 | 148/ 201 | 76/ 210 | 144/ 213 |
38.18% (2016)
-18.04% (2018)
| Name | Percent |
|---|---|
| Canadian Equity | 87.13 |
| Income Trust Units | 9.29 |
| US Equity | 2.58 |
| International Equity | 1.00 |
| Name | Percent |
|---|---|
| Basic Materials | 31.50 |
| Energy | 20.75 |
| Real Estate | 11.23 |
| Financial Services | 7.09 |
| Healthcare | 5.59 |
| Other | 23.84 |
| Name | Percent |
|---|---|
| North America | 99.00 |
| Asia | 1.00 |
| Name | Percent |
|---|---|
| Hudbay Minerals Inc | 1.53 |
| Athabasca Oil Corp | 1.38 |
| Chartwell Retirement Residences - Units | 1.37 |
| Peyto Exploration & Development Corp | 1.33 |
| Vermilion Energy Inc | 1.26 |
| Russel Metals Inc | 1.25 |
| Secure Energy Services Inc | 1.20 |
| Tilray Brands Inc | 1.14 |
| Altus Group Ltd | 1.09 |
| Equinox Gold Corp | 1.09 |

iShares S&P/TSX SmallCap Index ETF
Median
Other - Cdn Small/Mid Cap Equity
| Standard Deviation | 16.58% | 24.80% | 20.25% |
|---|---|---|---|
| Beta | 1.00% | 1.00% | 1.00% |
| Alpha | 0.00% | 0.00% | 0.00% |
| Rsquared | 1.00% | 1.00% | 1.00% |
| Sharpe | 0.15% | 0.35% | 0.22% |
| Sortino | 0.18% | 0.45% | 0.21% |
| Treynor | 0.02% | 0.09% | 0.05% |
| Tax Efficiency | 76.95% | 87.95% | 77.90% |
| Volatility |

|

|
|

| Key Ratio | 1 Yr | 3 Yr | 5 Yr | 10 Yr |
|---|---|---|---|---|
| Standard Deviation | 13.91% | 16.58% | 24.80% | 20.25% |
| Beta | 1.00% | 1.00% | 1.00% | 1.00% |
| Alpha | 0.00% | 0.00% | 0.00% | 0.00% |
| Rsquared | 1.00% | 1.00% | 1.00% | 1.00% |
| Sharpe | 0.26% | 0.15% | 0.35% | 0.22% |
| Sortino | 0.68% | 0.18% | 0.45% | 0.21% |
| Treynor | 0.04% | 0.02% | 0.09% | 0.05% |
| Tax Efficiency | 85.91% | 76.95% | 87.95% | 77.90% |
The E, S, and G scores are averaged for each security in the portfolio, to arrive at an ESG score for each security. We take the portfolio weighted average of the ESG scores for each fund and rank them against their peers to arrive at the Fundata ESG Score from 0-100.
Three scores under the Environment bucket are averaged to yield the Fundata Environment Score for each fund from 0-100: (1) Pollution Prevention, (2) Environmental Transparency, (3) Resource Efficiency.
Six scores under the Social bucket are averaged to yield the Fundata Social Score for each fund from 0-100. (1) Compensation and Satisfaction, (2) Diversity and Rights, (3) Education and Work Conditions, (4) Community and Charity, (5) Human Rights, (6) Sustainability Integration.
Three scores under the governance bucket are averaged to yield the Fundata Governance Score for each fund from 0-100: (1) Board Effectiveness, (2) Management Ethics, (3) Disclosure and Accountability.
Powered by OWL Analytics. For more information, please contact Fundata Canada.
| Start Date | May 14, 2007 |
|---|---|
| Instrument Type | Exchange Traded Fund |
| Share Class | Do-It-Yourself |
| Legal Status | Trust |
| Sales Status | Open |
| Currency | CAD |
| Distribution Frequency | Quarterly |
| Assets ($mil) | $137 |
| FundServ Code | Load Code | Sales Status |
|---|---|---|
| N/A | ||
The iShares Canadian Equity Funds seek to provide long-term capital growth by replicating, to the extent possible, the performance of the applicable Canadian Equity Fund Index, net of expenses.
The investment strategy of each iShares Canadian Equity Fund, other than XVX, is to invest primarily in and hold the Index Securities of the applicable Canadian Equity Fund Index in substantially the same proportion as they are reflected in the applicable Canadian Equity Fund Index.
| Name | Start Date |
|---|---|
| BlackRock Institutional Trust Company, N.A. | 05-14-2007 |
| BlackRock Asset Management Canada Limited | 05-14-2007 |
| Fund Manager | BlackRock Asset Management Canada Limited |
|---|---|
| Advisor | BlackRock Asset Management Canada Limited |
| Custodian | - |
| Registrar | - |
| Distributor | - |
| Auditor | PriceWaterhouseCoopers LLP |
| RSP Eligible | Yes |
|---|---|
| PAC Allowed | No |
| PAC Initial Investment | - |
| PAC Subsequent | - |
| SWP Allowed | No |
| SWP Min Balance | - |
| SWP Min Withdrawal | - |
| MER | 0.60% |
|---|---|
| Management Fee | 0.55% |
| Load | No Load |
| FE Max | - |
| DSC Max | - |
| Trailer Fee Max (FE) | - |
| Trailer Fee Max (DSC) | - |
| Trailer Fee Max (NL) | - |
| Trailer Fee Max (LL) | - |
Join Fund Library now and get free access to personalized features to help you manage your investments.
 Fund Library