Join Fund Library now and get free access to personalized features to help you manage your investments.
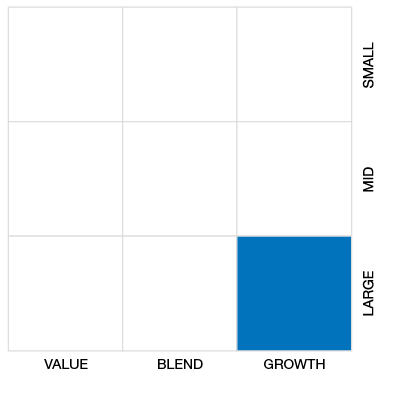
Global Small/Mid Cap Eq
 Click for more information on Fundata’s FundGrade
Click for more information on Fundata’s FundGrade.
 Click for more information on Fundata’s ESG Grade
Click for more information on Fundata’s ESG Grade.

2013
Click for more information on Fundata’s FundGrade
|
NAVPS (05-17-2024) |
$13.35 |
|---|---|
| Change |
-$0.02
(-0.13%)
|
As at April 30, 2024
As at March 31, 2024
As at February 29, 2024
Inception Return (June 11, 2007): 1.51%
| Row Heading | Return | Annualized Return | ||||||||||||
|---|---|---|---|---|---|---|---|---|---|---|---|---|---|---|
| 1 Mth | 3 Mth | 6 Mth | YTD | 1 Yr | 2 Yr | 3 Yr | 4 Yr | 5 Yr | 6 Yr | 7 Yr | 8 Yr | 9 Yr | 10 Yr | |
| Fund | -6.83% | -2.13% | 13.30% | -6.71% | -0.60% | -4.42% | -14.47% | -4.94% | -7.79% | -6.78% | -5.87% | -2.08% | -2.82% | -1.96% |
| Benchmark | -3.18% | 5.85% | 17.91% | 4.23% | 13.66% | 9.09% | 3.29% | 11.85% | 6.73% | 6.36% | 6.47% | 8.73% | 7.45% | 8.39% |
| Category Average | -3.01% | 16.09% | 16.09% | 2.97% | 9.68% | 6.68% | 0.43% | 9.80% | 5.15% | 4.16% | 4.31% | 5.97% | 4.65% | 5.33% |
| Category Rank | 273 / 273 | 264 / 270 | 225 / 270 | 264 / 270 | 224 / 263 | 236 / 242 | 220 / 222 | 202 / 203 | 180 / 181 | 152 / 153 | 141 / 142 | 136 / 137 | 112 / 112 | 90 / 90 |
| Quartile Ranking | 4 | 4 | 4 | 4 | 4 | 4 | 4 | 4 | 4 | 4 | 4 | 4 | 4 | 4 |
| Return % | May | Jun | Jul | Aug | Sep | Oct | Nov | Dec | Jan | Feb | Mar | Apr |
|---|---|---|---|---|---|---|---|---|---|---|---|---|
| Fund | 5.59% | 2.10% | 3.02% | -7.03% | -8.52% | -7.13% | 11.47% | 8.96% | -4.68% | 3.95% | 1.04% | -6.83% |
| Benchmark | -2.87% | 4.01% | 4.07% | -0.53% | -4.79% | -3.18% | 7.14% | 5.59% | -1.54% | 5.26% | 3.87% | -3.18% |
17.81% (April 2009)
-26.35% (March 2020)
| Return % | 2014 | 2015 | 2016 | 2017 | 2018 | 2019 | 2020 | 2021 | 2022 | 2023 |
|---|---|---|---|---|---|---|---|---|---|---|
| Fund | 8.39% | 4.01% | 11.04% | 11.46% | -13.04% | 11.79% | 4.86% | -1.69% | -38.59% | 11.88% |
| Benchmark | 9.59% | 16.61% | 7.47% | 15.40% | -7.34% | 20.09% | 11.07% | 15.50% | -13.14% | 14.59% |
| Category Average | 6.30% | 9.56% | 3.48% | 12.62% | -10.42% | 13.76% | 14.53% | 12.37% | -15.59% | 12.82% |
| Quartile Ranking | 3 | 4 | 2 | 3 | 4 | 3 | 4 | 4 | 4 | 3 |
| Category Rank | 57/ 89 | 95/ 107 | 35/ 137 | 92/ 142 | 134/ 152 | 115/ 178 | 150/ 184 | 217/ 219 | 241/ 241 | 146/ 257 |
11.88% (2023)
-38.59% (2022)
| Name | Percent |
|---|---|
| US Equity | 50.26 |
| International Equity | 47.72 |
| Cash and Equivalents | 1.22 |
| Canadian Equity | 0.80 |
| Name | Percent |
|---|---|
| Industrial Goods | 22.85 |
| Technology | 22.78 |
| Healthcare | 12.68 |
| Basic Materials | 9.74 |
| Consumer Goods | 7.75 |
| Other | 24.20 |
| Name | Percent |
|---|---|
| North America | 51.90 |
| Europe | 26.49 |
| Asia | 19.45 |
| Latin America | 2.15 |
| Other | 0.01 |
| Name | Percent |
|---|---|
| Advanced Micro Devices Inc | 3.13 |
| Manhattan Associates Inc | 3.02 |
| Disco Corp | 2.58 |
| Jack Henry & Associates Inc | 2.53 |
| SEI Investments Co | 2.33 |
| Carl Zeiss Meditec AG | 2.12 |
| Deckers Outdoor Corp | 1.95 |
| Qualcomm Inc | 1.81 |
| Pool Corp | 1.74 |
| Lincoln Electric Holdings Inc | 1.72 |

Invesco Global Opportunities Class Series A
Median
Other - Global Small/Mid Cap Eq
| Standard Deviation | 23.37% | 24.98% | 19.22% |
|---|---|---|---|
| Beta | 1.36% | 1.32% | 1.19% |
| Alpha | -0.19% | -0.15% | -0.11% |
| Rsquared | 0.76% | 0.78% | 0.75% |
| Sharpe | -0.67% | -0.28% | -0.08% |
| Sortino | -0.85% | -0.41% | -0.21% |
| Treynor | -0.11% | -0.05% | -0.01% |
| Tax Efficiency | - | - | - |
| Volatility |

|
|
|

| Key Ratio | 1 Yr | 3 Yr | 5 Yr | 10 Yr |
|---|---|---|---|---|
| Standard Deviation | 23.68% | 23.37% | 24.98% | 19.22% |
| Beta | 1.31% | 1.36% | 1.32% | 1.19% |
| Alpha | -0.16% | -0.19% | -0.15% | -0.11% |
| Rsquared | 0.65% | 0.76% | 0.78% | 0.75% |
| Sharpe | -0.12% | -0.67% | -0.28% | -0.08% |
| Sortino | -0.07% | -0.85% | -0.41% | -0.21% |
| Treynor | -0.02% | -0.11% | -0.05% | -0.01% |
| Tax Efficiency | - | - | - | - |
The E, S, and G scores are averaged for each security in the portfolio, to arrive at an ESG score for each security. We take the portfolio weighted average of the ESG scores for each fund and rank them against their peers to arrive at the Fundata ESG Score from 0-100.
Three scores under the Environment bucket are averaged to yield the Fundata Environment Score for each fund from 0-100: (1) Pollution Prevention, (2) Environmental Transparency, (3) Resource Efficiency.
Six scores under the Social bucket are averaged to yield the Fundata Social Score for each fund from 0-100. (1) Compensation and Satisfaction, (2) Diversity and Rights, (3) Education and Work Conditions, (4) Community and Charity, (5) Human Rights, (6) Sustainability Integration.
Three scores under the governance bucket are averaged to yield the Fundata Governance Score for each fund from 0-100: (1) Board Effectiveness, (2) Management Ethics, (3) Disclosure and Accountability.
Powered by OWL Analytics. For more information, please contact Fundata Canada.
| Start Date | June 11, 2007 |
|---|---|
| Instrument Type | Mutual Fund |
| Share Class | Commission Based Advice |
| Legal Status | Corporation |
| Sales Status | Open |
| Currency | CAD |
| Distribution Frequency | Annual |
| Assets ($mil) | $66 |
| FundServ Code | Load Code | Sales Status |
|---|---|---|
| AIM25211 | ||
| AIM25213 | ||
| AIM25215 | ||
| AIM25219 |
Invesco Global Opportunities Class seeks to generate strong capital growth over the long-term. The Fund invests primarily in equities of small-cap and mid-cap equity companies from anywhere in the world. The investment objectives of the Fund cannot be changed without the approval of a majority of the investors at a meeting called to consider the change.
To achieve these objectives, the portfolio management team uses fundamental analysis and a bottom-up approach to select companies that: a) are likely to gain a greater share of global gross domestic product and that have long-term economic drivers that should serve as tailwinds for enduring growth. These drivers include mass affluence, new technology, restructuring and aging (MANTRA).
| Name | Start Date |
|---|---|
| Virginia Au | 12-08-2020 |
| Rob Mikalachki | 12-08-2020 |
| Frank Jennings | 12-08-2020 |
| Maire Lane | 12-08-2020 |
| David A. Nadel | 08-01-2023 |
| Fund Manager | Invesco Canada Ltd. |
|---|---|
| Advisor | Invesco Canada Ltd. |
| Custodian | CIBC Mellon Trust Company |
| Registrar | Invesco Canada Ltd. |
| Distributor | - |
| Auditor | PriceWaterhouseCoopers LLP |
| RSP Eligible | Yes |
|---|---|
| PAC Allowed | Yes |
| PAC Initial Investment | 50 |
| PAC Subsequent | 50 |
| SWP Allowed | Yes |
| SWP Min Balance | 10,000 |
| SWP Min Withdrawal | 100 |
| MER | 2.97% |
|---|---|
| Management Fee | 2.00% |
| Load | Choice of Front or No Load |
| FE Max | 5.00% |
| DSC Max | - |
| Trailer Fee Max (FE) | 1.00% |
| Trailer Fee Max (DSC) | 1.00% |
| Trailer Fee Max (NL) | - |
| Trailer Fee Max (LL) | - |
Join Fund Library now and get free access to personalized features to help you manage your investments.
 Fund Library