Join Fund Library now and get free access to personalized features to help you manage your investments.
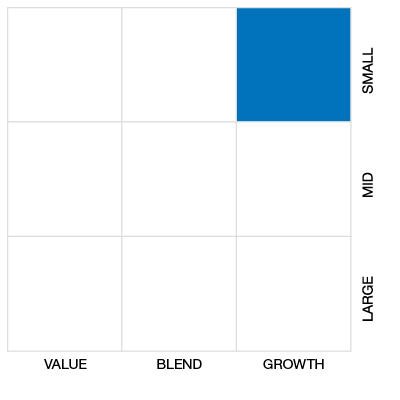
Cdn Small/Mid Cap Equity
 Click for more information on Fundata’s FundGrade
Click for more information on Fundata’s FundGrade.
 Click for more information on Fundata’s ESG Grade
Click for more information on Fundata’s ESG Grade.

2014
Click for more information on Fundata’s FundGrade

2017, 2016, 2014, 2013
Click for more information on Fundata’s FundGrade
|
NAVPS (05-03-2024) |
$32.80 |
|---|---|
| Change |
-$0.20
(-0.60%)
|
As at March 31, 2024
As at February 29, 2024
As at February 29, 2024
Inception Return (January 11, 1995): 9.94%
| Row Heading | Return | Annualized Return | ||||||||||||
|---|---|---|---|---|---|---|---|---|---|---|---|---|---|---|
| 1 Mth | 3 Mth | 6 Mth | YTD | 1 Yr | 2 Yr | 3 Yr | 4 Yr | 5 Yr | 6 Yr | 7 Yr | 8 Yr | 9 Yr | 10 Yr | |
| Fund | 1.36% | 3.66% | 13.13% | 3.66% | 12.59% | 5.53% | 8.34% | 19.88% | 8.83% | 7.70% | 6.15% | 7.39% | 6.40% | 5.59% |
| Benchmark | 7.49% | 7.92% | 14.37% | 7.92% | 8.22% | -2.72% | 3.99% | 22.48% | 7.82% | 6.15% | 4.23% | 7.10% | 5.60% | 3.95% |
| Category Average | 2.61% | 14.11% | 14.11% | 6.51% | 10.12% | 0.74% | 4.35% | 17.73% | 7.77% | 6.09% | 4.99% | 6.38% | 4.84% | 4.30% |
| Category Rank | 197 / 219 | 211 / 216 | 176 / 215 | 211 / 216 | 76 / 215 | 39 / 213 | 50 / 203 | 67 / 195 | 91 / 187 | 74 / 179 | 78 / 169 | 81 / 167 | 62 / 143 | 69 / 138 |
| Quartile Ranking | 4 | 4 | 4 | 4 | 2 | 1 | 1 | 2 | 2 | 2 | 2 | 2 | 2 | 2 |
| Return % | Apr | May | Jun | Jul | Aug | Sep | Oct | Nov | Dec | Jan | Feb | Mar |
|---|---|---|---|---|---|---|---|---|---|---|---|---|
| Fund | 0.91% | -0.42% | 1.35% | 2.39% | -2.65% | -1.97% | -1.37% | 5.52% | 4.86% | 1.75% | 0.51% | 1.36% |
| Benchmark | -1.16% | -4.06% | 0.59% | 6.09% | -1.31% | -5.24% | -2.58% | 4.84% | 3.76% | -0.37% | 0.77% | 7.49% |
14.04% (February 2000)
-26.11% (March 2020)
| Return % | 2014 | 2015 | 2016 | 2017 | 2018 | 2019 | 2020 | 2021 | 2022 | 2023 |
|---|---|---|---|---|---|---|---|---|---|---|
| Fund | 5.64% | -6.81% | 23.03% | 2.12% | -11.29% | 15.02% | 1.72% | 25.10% | -0.11% | 10.16% |
| Benchmark | -2.34% | -13.31% | 38.48% | 2.75% | -18.17% | 15.84% | 12.87% | 20.27% | -9.29% | 4.79% |
| Category Average | 3.45% | -6.13% | 18.01% | 3.43% | -15.15% | 16.59% | 11.91% | 22.35% | -11.32% | 6.49% |
| Quartile Ranking | 3 | 3 | 2 | 3 | 1 | 4 | 4 | 2 | 1 | 2 |
| Category Rank | 76/ 137 | 105/ 142 | 42/ 164 | 101/ 169 | 33/ 179 | 159/ 186 | 165/ 191 | 75/ 203 | 22/ 212 | 68/ 215 |
25.10% (2021)
-11.29% (2018)
| Name | Percent |
|---|---|
| Canadian Equity | 93.66 |
| Income Trust Units | 2.58 |
| Cash and Equivalents | 2.48 |
| US Equity | 1.28 |
| Name | Percent |
|---|---|
| Financial Services | 18.43 |
| Energy | 17.02 |
| Basic Materials | 11.79 |
| Industrial Services | 11.09 |
| Consumer Services | 9.28 |
| Other | 32.39 |
| Name | Percent |
|---|---|
| North America | 100.00 |
| Name | Percent |
|---|---|
| Canadian Western Bank | 4.64 |
| Winpak Ltd | 4.36 |
| AltaGas Ltd | 4.22 |
| Parkland Fuel Corp | 4.10 |
| Secure Energy Services Inc | 4.00 |
| Stella-Jones Inc | 4.00 |
| Mullen Group Ltd | 3.85 |
| Guardian Capital Group Ltd Cl A | 3.76 |
| iA Financial Corp Inc | 3.64 |
| Calian Group Ltd | 3.61 |

NEI Canadian Small Cap Equity RS Fund Series A
Median
Other - Cdn Small/Mid Cap Equity
| Standard Deviation | 10.62% | 17.67% | 13.91% |
|---|---|---|---|
| Beta | 0.52% | 0.64% | 0.59% |
| Alpha | 0.06% | 0.03% | 0.03% |
| Rsquared | 0.66% | 0.82% | 0.74% |
| Sharpe | 0.56% | 0.47% | 0.37% |
| Sortino | 0.83% | 0.53% | 0.33% |
| Treynor | 0.12% | 0.13% | 0.09% |
| Tax Efficiency | 87.11% | 91.62% | 80.27% |
| Volatility |

|

|

|

| Key Ratio | 1 Yr | 3 Yr | 5 Yr | 10 Yr |
|---|---|---|---|---|
| Standard Deviation | 8.62% | 10.62% | 17.67% | 13.91% |
| Beta | 0.44% | 0.52% | 0.64% | 0.59% |
| Alpha | 0.08% | 0.06% | 0.03% | 0.03% |
| Rsquared | 0.52% | 0.66% | 0.82% | 0.74% |
| Sharpe | 0.87% | 0.56% | 0.47% | 0.37% |
| Sortino | 2.29% | 0.83% | 0.53% | 0.33% |
| Treynor | 0.17% | 0.12% | 0.13% | 0.09% |
| Tax Efficiency | 91.70% | 87.11% | 91.62% | 80.27% |
The E, S, and G scores are averaged for each security in the portfolio, to arrive at an ESG score for each security. We take the portfolio weighted average of the ESG scores for each fund and rank them against their peers to arrive at the Fundata ESG Score from 0-100.
Three scores under the Environment bucket are averaged to yield the Fundata Environment Score for each fund from 0-100: (1) Pollution Prevention, (2) Environmental Transparency, (3) Resource Efficiency.
Six scores under the Social bucket are averaged to yield the Fundata Social Score for each fund from 0-100. (1) Compensation and Satisfaction, (2) Diversity and Rights, (3) Education and Work Conditions, (4) Community and Charity, (5) Human Rights, (6) Sustainability Integration.
Three scores under the governance bucket are averaged to yield the Fundata Governance Score for each fund from 0-100: (1) Board Effectiveness, (2) Management Ethics, (3) Disclosure and Accountability.
Powered by OWL Analytics. For more information, please contact Fundata Canada.
| Start Date | January 11, 1995 |
|---|---|
| Instrument Type | Mutual Fund (Responsible Investment) |
| Share Class | Commission Based Advice |
| Legal Status | Trust |
| Sales Status | Open |
| Currency | CAD |
| Distribution Frequency | Annual |
| Assets ($mil) | - |
| FundServ Code | Load Code | Sales Status |
|---|---|---|
| NWT067 | ||
| NWT10067 | ||
| NWT167 | ||
| NWT267 | ||
| NWT367 | ||
| NWT667 |
The Fund aims to increase the value of your investment over the long-term by investing mostly in common shares of small capitalization or “small cap” Canadian companies listed on a stock exchange. The Fund follows a responsible approach to investing, as described on pages 74 to 79 of this prospectus. Unitholder approval (by a majority of votes cast at a meeting of unitholders) is required prior to a fundamental change of investment objectives.
The Portfolio Manager invests mostly in small cap companies having a market capitalization at the time of investment between $100 million and $2.5 billion. The Portfolio Manager uses a fundamental research approach, employing a bottom-up stock selection process that includes company visits and management interviews.
| Name | Start Date |
|---|---|
| Steven Kim | 03-01-2012 |
| Derek Nichol | 03-31-2023 |
| Fund Manager | Northwest & Ethical Investments L.P. |
|---|---|
| Advisor | QV Investors Inc. |
| Custodian | Desjardins Trust Inc. |
| Registrar | Northwest & Ethical Investments L.P. |
| Distributor | Credential Asset Management Inc. |
| Auditor | Ernst & Young LLP |
| RSP Eligible | Yes |
|---|---|
| PAC Allowed | Yes |
| PAC Initial Investment | 500 |
| PAC Subsequent | 25 |
| SWP Allowed | Yes |
| SWP Min Balance | 5,000 |
| SWP Min Withdrawal | 100 |
| MER | 2.70% |
|---|---|
| Management Fee | 2.10% |
| Load | Choice of Front or No Load |
| FE Max | 5.00% |
| DSC Max | 6.00% |
| Trailer Fee Max (FE) | 1.00% |
| Trailer Fee Max (DSC) | 0.50% |
| Trailer Fee Max (NL) | - |
| Trailer Fee Max (LL) | - |
Join Fund Library now and get free access to personalized features to help you manage your investments.
 Fund Library