Join Fund Library now and get free access to personalized features to help you manage your investments.
International Equity
 Click for more information on Fundata’s FundGrade
Click for more information on Fundata’s FundGrade.
 Click for more information on Fundata’s ESG Grade
Click for more information on Fundata’s ESG Grade.
|
NAVPS (05-03-2024) |
$13.24 |
|---|---|
| Change |
$0.13
(0.97%)
|
As at March 31, 2024
As at March 31, 2024
As at February 29, 2024
Inception Return (November 07, 2005): 3.40%
| Row Heading | Return | Annualized Return | ||||||||||||
|---|---|---|---|---|---|---|---|---|---|---|---|---|---|---|
| 1 Mth | 3 Mth | 6 Mth | YTD | 1 Yr | 2 Yr | 3 Yr | 4 Yr | 5 Yr | 6 Yr | 7 Yr | 8 Yr | 9 Yr | 10 Yr | |
| Fund | 2.65% | 5.73% | 11.37% | 5.73% | 8.32% | 6.17% | 3.25% | 9.75% | 4.32% | 3.34% | 3.73% | 5.39% | 3.96% | 4.83% |
| Benchmark | 3.12% | 7.59% | 16.68% | 7.59% | 15.23% | 9.95% | 5.89% | 11.85% | 7.22% | 5.75% | 6.70% | 7.66% | 6.18% | 6.93% |
| Category Average | 2.83% | 15.60% | 15.60% | 7.05% | 12.44% | 8.29% | 4.27% | 10.73% | 6.20% | 4.82% | 5.67% | 6.45% | 5.01% | 5.58% |
| Category Rank | 485 / 783 | 550 / 775 | 648 / 763 | 550 / 775 | 621 / 742 | 629 / 719 | 500 / 694 | 427 / 656 | 528 / 620 | 473 / 540 | 420 / 476 | 326 / 423 | 298 / 366 | 259 / 337 |
| Quartile Ranking | 3 | 3 | 4 | 3 | 4 | 4 | 3 | 3 | 4 | 4 | 4 | 4 | 4 | 4 |
| Return % | Apr | May | Jun | Jul | Aug | Sep | Oct | Nov | Dec | Jan | Feb | Mar |
|---|---|---|---|---|---|---|---|---|---|---|---|---|
| Fund | 0.81% | -4.57% | 2.31% | 3.95% | -2.14% | -2.85% | -2.51% | 5.54% | 2.38% | -0.38% | 3.40% | 2.65% |
| Benchmark | 2.76% | -3.45% | 1.52% | 3.11% | -1.30% | -3.65% | -1.92% | 7.38% | 2.98% | 0.90% | 3.40% | 3.12% |
11.48% (November 2022)
-13.60% (October 2008)
| Return % | 2014 | 2015 | 2016 | 2017 | 2018 | 2019 | 2020 | 2021 | 2022 | 2023 |
|---|---|---|---|---|---|---|---|---|---|---|
| Fund | 1.74% | 11.75% | 1.91% | 16.24% | -9.99% | 14.84% | 2.01% | 8.48% | -8.71% | 8.88% |
| Benchmark | 4.12% | 19.41% | -1.70% | 18.37% | -6.81% | 16.27% | 8.01% | 8.97% | -10.67% | 15.74% |
| Category Average | 1.55% | 13.82% | -2.56% | 17.84% | -8.91% | 17.54% | 7.87% | 8.64% | -12.60% | 13.75% |
| Quartile Ranking | 3 | 4 | 1 | 3 | 3 | 3 | 3 | 3 | 2 | 4 |
| Category Rank | 216/ 325 | 294/ 363 | 100/ 408 | 275/ 468 | 346/ 531 | 420/ 599 | 462/ 653 | 382/ 684 | 233/ 707 | 713/ 738 |
16.24% (2017)
-9.99% (2018)
| Name | Percent |
|---|---|
| International Equity | 96.56 |
| Cash and Equivalents | 2.24 |
| US Equity | 0.54 |
| Income Trust Units | 0.39 |
| Canadian Equity | 0.34 |
| Other | -0.07 |
| Name | Percent |
|---|---|
| Financial Services | 21.02 |
| Technology | 17.65 |
| Consumer Goods | 14.42 |
| Industrial Goods | 10.45 |
| Consumer Services | 7.80 |
| Other | 28.66 |
| Name | Percent |
|---|---|
| Europe | 46.46 |
| Asia | 38.51 |
| Latin America | 9.56 |
| North America | 2.77 |
| Africa and Middle East | 2.63 |
| Other | 0.07 |
| Name | Percent |
|---|---|
| Taiwan Semiconductor Manufactrg Co Ltd - ADR | 1.75 |
| CAD Cash Sweep | 1.73 |
| Alibaba Group Holding Ltd | 1.44 |
| Accor SA | 1.44 |
| Novo Nordisk A/S Cl B | 1.32 |
| Sap SE | 1.30 |
| Fomento Economico Mexicano SAB de CV - ADR | 1.21 |
| Lloyds Banking Group PLC | 1.21 |
| BAE Systems PLC | 1.19 |
| Shell PLC | 1.10 |
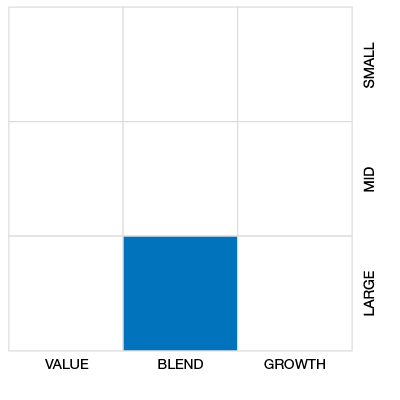

CI Select International Equity Managed Corporate Class (Class A shares)
Median
Other - International Equity
| Standard Deviation | 11.98% | 13.53% | 11.84% |
|---|---|---|---|
| Beta | 0.85% | 0.94% | 0.91% |
| Alpha | -0.02% | -0.02% | -0.01% |
| Rsquared | 0.90% | 0.91% | 0.90% |
| Sharpe | 0.11% | 0.24% | 0.34% |
| Sortino | 0.12% | 0.23% | 0.29% |
| Treynor | 0.02% | 0.03% | 0.04% |
| Tax Efficiency | 84.45% | 86.40% | 80.02% |
| Volatility |

|
|
|

| Key Ratio | 1 Yr | 3 Yr | 5 Yr | 10 Yr |
|---|---|---|---|---|
| Standard Deviation | 10.98% | 11.98% | 13.53% | 11.84% |
| Beta | 0.93% | 0.85% | 0.94% | 0.91% |
| Alpha | -0.05% | -0.02% | -0.02% | -0.01% |
| Rsquared | 0.91% | 0.90% | 0.91% | 0.90% |
| Sharpe | 0.35% | 0.11% | 0.24% | 0.34% |
| Sortino | 0.82% | 0.12% | 0.23% | 0.29% |
| Treynor | 0.04% | 0.02% | 0.03% | 0.04% |
| Tax Efficiency | 100.00% | 84.45% | 86.40% | 80.02% |
The E, S, and G scores are averaged for each security in the portfolio, to arrive at an ESG score for each security. We take the portfolio weighted average of the ESG scores for each fund and rank them against their peers to arrive at the Fundata ESG Score from 0-100.
Three scores under the Environment bucket are averaged to yield the Fundata Environment Score for each fund from 0-100: (1) Pollution Prevention, (2) Environmental Transparency, (3) Resource Efficiency.
Six scores under the Social bucket are averaged to yield the Fundata Social Score for each fund from 0-100. (1) Compensation and Satisfaction, (2) Diversity and Rights, (3) Education and Work Conditions, (4) Community and Charity, (5) Human Rights, (6) Sustainability Integration.
Three scores under the governance bucket are averaged to yield the Fundata Governance Score for each fund from 0-100: (1) Board Effectiveness, (2) Management Ethics, (3) Disclosure and Accountability.
Powered by OWL Analytics. For more information, please contact Fundata Canada.
| Start Date | November 07, 2005 |
|---|---|
| Instrument Type | Mutual Fund |
| Share Class | Commission Based Advice |
| Legal Status | Corporation |
| Sales Status | Open |
| Currency | CAD |
| Distribution Frequency | Quarterly |
| Assets ($mil) | $73 |
| FundServ Code | Load Code | Sales Status |
|---|---|---|
| CIG1334 | ||
| CIG1418 | ||
| CIG2218 | ||
| CIG3218 | ||
| CIG3234 |
The primary investment objective of the fund is to provide capital growth through direct or indirect investments primarily in equity and equity-related securities of international issuers that the portfolio advisers believe represent good value and have the potential for positive total return. A portion of the assets may be invested in companies that are located in, or with significant economic exposure to, emerging market countries.
The fund employs a “multi-style, multi-manager” approach, which means that it is managed by more than one individual portfolio manager or portfolio management team, each exhibiting a distinct investment style. This approach assists in diversifying the risk associated with an individual portfolio manager’s or portfolio management team’s investment process and style.
| Name | Start Date |
|---|---|
| CI Global Investments Inc | 11-07-2005 |
| Alfred Lam | 11-07-2005 |
| BlackRock Investment Management Inc. | 11-07-2005 |
| Altrinsic Global Advisors, LLC | 12-03-2020 |
| Fund Manager | CI Investments Inc |
|---|---|
| Advisor | CI Investments Inc |
| Custodian | RBC Investor Services Trust (Canada) |
| Registrar | CI Investments Inc |
| Distributor | - |
| Auditor | Ernst & Young LLP |
| RSP Eligible | Yes |
|---|---|
| PAC Allowed | Yes |
| PAC Initial Investment | 250 |
| PAC Subsequent | 250 |
| SWP Allowed | Yes |
| SWP Min Balance | 25,000 |
| SWP Min Withdrawal | 250 |
| MER | 2.49% |
|---|---|
| Management Fee | 2.00% |
| Load | Choice of Front or No Load |
| FE Max | 5.00% |
| DSC Max | - |
| Trailer Fee Max (FE) | 1.00% |
| Trailer Fee Max (DSC) | 0.50% |
| Trailer Fee Max (NL) | - |
| Trailer Fee Max (LL) | - |
Join Fund Library now and get free access to personalized features to help you manage your investments.
 Fund Library