Join Fund Library now and get free access to personalized features to help you manage your investments.
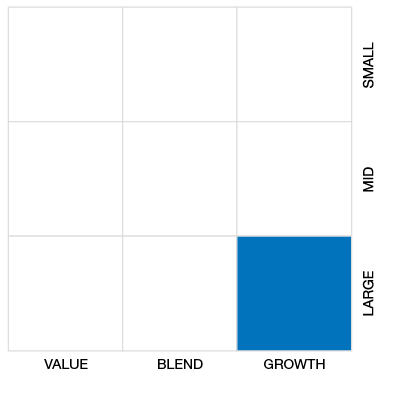
Global Fixed Inc Balanced
 Click for more information on Fundata’s FundGrade
Click for more information on Fundata’s FundGrade.
|
NAVPS (05-03-2024) |
$9.64 |
|---|---|
| Change |
$0.05
(0.56%)
|
As at March 31, 2024
As at February 29, 2024
Inception Return (October 30, 2017): 1.33%
| Row Heading | Return | Annualized Return | ||||||||||||
|---|---|---|---|---|---|---|---|---|---|---|---|---|---|---|
| 1 Mth | 3 Mth | 6 Mth | YTD | 1 Yr | 2 Yr | 3 Yr | 4 Yr | 5 Yr | 6 Yr | 7 Yr | 8 Yr | 9 Yr | 10 Yr | |
| Fund | 1.20% | 0.95% | 8.97% | 0.95% | 6.36% | 1.46% | 0.30% | 2.82% | 1.23% | 1.50% | - | - | - | - |
| Benchmark | 1.04% | 2.83% | 9.37% | 2.83% | 5.66% | 2.64% | 0.26% | 0.62% | 1.90% | 2.31% | 2.72% | 3.04% | 3.24% | 4.26% |
| Category Average | 1.42% | 9.52% | 9.52% | 2.30% | 6.66% | 1.54% | 1.00% | 4.45% | 2.74% | 2.77% | 2.74% | 3.17% | 2.58% | 3.02% |
| Category Rank | 701 / 960 | 933 / 960 | 599 / 924 | 933 / 960 | 466 / 908 | 543 / 898 | 639 / 813 | 618 / 762 | 664 / 734 | 545 / 624 | - | - | - | - |
| Quartile Ranking | 3 | 4 | 3 | 4 | 3 | 3 | 4 | 4 | 4 | 4 | - | - | - | - |
| Return % | Apr | May | Jun | Jul | Aug | Sep | Oct | Nov | Dec | Jan | Feb | Mar |
|---|---|---|---|---|---|---|---|---|---|---|---|---|
| Fund | 0.83% | -1.02% | 0.49% | 0.36% | -0.50% | -2.54% | -0.25% | 4.60% | 3.46% | -0.63% | 0.38% | 1.20% |
| Benchmark | 1.00% | -1.55% | -1.21% | 0.72% | 1.08% | -3.41% | 0.82% | 3.70% | 1.73% | 0.36% | 1.41% | 1.04% |
4.60% (November 2023)
-6.95% (March 2020)
| Return % | 2014 | 2015 | 2016 | 2017 | 2018 | 2019 | 2020 | 2021 | 2022 | 2023 |
|---|---|---|---|---|---|---|---|---|---|---|
| Fund | - | - | - | - | -1.68% | 7.21% | 3.07% | 2.55% | -10.57% | 8.12% |
| Benchmark | 11.35% | 16.91% | 0.39% | 3.81% | 5.53% | 6.30% | 9.09% | -0.49% | -11.13% | 6.74% |
| Category Average | 6.43% | 1.21% | 4.39% | 5.49% | -2.85% | 9.97% | 7.08% | 4.51% | -11.10% | 7.71% |
| Quartile Ranking | - | - | - | - | 2 | 4 | 4 | 4 | 2 | 2 |
| Category Rank | - | - | - | - | 254/ 614 | 659/ 705 | 710/ 762 | 670/ 813 | 387/ 867 | 355/ 908 |
8.12% (2023)
-10.57% (2022)
| Name | Percent |
|---|---|
| Canadian Corporate Bonds | 32.79 |
| Foreign Corporate Bonds | 17.64 |
| Canadian Government Bonds | 15.35 |
| US Equity | 9.96 |
| International Equity | 6.80 |
| Other | 17.46 |
| Name | Percent |
|---|---|
| Fixed Income | 74.12 |
| Cash and Cash Equivalent | 5.96 |
| Technology | 4.31 |
| Financial Services | 3.97 |
| Consumer Services | 1.92 |
| Other | 9.72 |
| Name | Percent |
|---|---|
| North America | 86.59 |
| Europe | 7.54 |
| Asia | 3.90 |
| Latin America | 1.30 |
| Africa and Middle East | 0.44 |
| Other | 0.23 |
| Name | Percent |
|---|---|
| Invesco 1-5 Yr Lad Inv Gra Corp Bond Idx ETF (PSB) | 23.91 |
| Invesco ESG Global Bond ETF (IWBE) | 19.86 |
| Invesco ESG Canadian Core Plus Bond ETF (BESG) | 15.02 |
| Invesco Long Term Government Bond Index ETF (PGL) | 10.90 |
| Invesco Fundamental HY Corp Bond (PFH.F) | 9.91 |
| Invesco NASDAQ 100 Index ETF - CAD Units (QQC) | 4.51 |
| Invesco FTSE RAFI U.S. Index ETF II (PXS) | 4.01 |
| Invesco FTSE RAFI Developed Mkts ex-US ETF (PXF) | 2.24 |
| Invesco S&P Intl Developed Low Vol ETF (IDLV) | 1.97 |
| Invesco S&P 500 Low Volatility Idx ETF (ULV.C) | 1.74 |

Invesco Conservative ETF Portfolio Series A
Median
Other - Global Fixed Inc Balanced
| Standard Deviation | 7.08% | 6.92% | - |
|---|---|---|---|
| Beta | 0.81% | 0.75% | - |
| Alpha | 0.00% | 0.00% | - |
| Rsquared | 0.71% | 0.46% | - |
| Sharpe | -0.29% | -0.07% | - |
| Sortino | -0.48% | -0.29% | - |
| Treynor | -0.03% | -0.01% | - |
| Tax Efficiency | - | 42.52% | - |
| Volatility |

|

|
- |
| Key Ratio | 1 Yr | 3 Yr | 5 Yr | 10 Yr |
|---|---|---|---|---|
| Standard Deviation | 6.65% | 7.08% | 6.92% | - |
| Beta | 0.88% | 0.81% | 0.75% | - |
| Alpha | 0.01% | 0.00% | 0.00% | - |
| Rsquared | 0.68% | 0.71% | 0.46% | - |
| Sharpe | 0.25% | -0.29% | -0.07% | - |
| Sortino | 1.02% | -0.48% | -0.29% | - |
| Treynor | 0.02% | -0.03% | -0.01% | - |
| Tax Efficiency | 85.20% | - | 42.52% | - |
| Start Date | October 30, 2017 |
|---|---|
| Instrument Type | Mutual Fund (Wrap Program) |
| Share Class | Commission Based Advice |
| Legal Status | Trust |
| Sales Status | Open |
| Currency | CAD |
| Distribution Frequency | Quarterly |
| Assets ($mil) | $9 |
| FundServ Code | Load Code | Sales Status |
|---|---|---|
| AIM5123 |
Invesco Conservative ETF Portfolio seeks to generate income with the potential for modest capital appreciation over the long term. Invesco Conservative ETF Portfolio invests in a diversified mix of exchange-traded funds and/or mutual funds. These ETFs and mutual funds invest primarily in fixed-income and/or other debt securities.
To achieve these objectives, the portfolio management team: Determines the strategic asset allocation annually and allocates assets among underlying funds accordingly. Invesco Conservative ETF Portfolio’s strategic asset allocation as between equities and fixed-income investments is: Equities 20%, Fixed-income 80%; Selects the appropriate underlying funds managed by us, our affiliates or associates or a third party as well as weightings of each underlying fund or ETF on an annual basis.
| Name | Start Date |
|---|---|
| Invesco Canada Ltd. | 10-30-2017 |
| Duy Nguyen | 10-30-2017 |
| Jacob Borbidge | 10-30-2017 |
| Fund Manager | Invesco Canada Ltd. |
|---|---|
| Advisor | Invesco Canada Ltd. |
| Custodian | CIBC Mellon Trust Company |
| Registrar | Invesco Canada Ltd. |
| Distributor | - |
| Auditor | PriceWaterhouseCoopers LLP |
| RSP Eligible | Yes |
|---|---|
| PAC Allowed | No |
| PAC Initial Investment | - |
| PAC Subsequent | - |
| SWP Allowed | No |
| SWP Min Balance | - |
| SWP Min Withdrawal | - |
| MER | 1.73% |
|---|---|
| Management Fee | 1.41% |
| Load | Back Fee Only |
| FE Max | 5.00% |
| DSC Max | - |
| Trailer Fee Max (FE) | 1.00% |
| Trailer Fee Max (DSC) | - |
| Trailer Fee Max (NL) | - |
| Trailer Fee Max (LL) | - |
Join Fund Library now and get free access to personalized features to help you manage your investments.
 Fund Library