Join Fund Library now and get free access to personalized features to help you manage your investments.
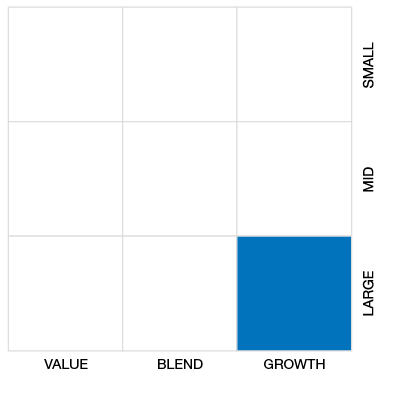
Global Neutral Balanced
 Click for more information on Fundata’s FundGrade
Click for more information on Fundata’s FundGrade.

2022
Click for more information on Fundata’s FundGrade
|
NAVPS (05-03-2024) |
$11.45 |
|---|---|
| Change |
$0.08
(0.74%)
|
As at March 31, 2024
As at January 31, 2024
Inception Return (July 14, 2017): 4.17%
| Row Heading | Return | Annualized Return | ||||||||||||
|---|---|---|---|---|---|---|---|---|---|---|---|---|---|---|
| 1 Mth | 3 Mth | 6 Mth | YTD | 1 Yr | 2 Yr | 3 Yr | 4 Yr | 5 Yr | 6 Yr | 7 Yr | 8 Yr | 9 Yr | 10 Yr | |
| Fund | 1.84% | 4.70% | 12.08% | 4.70% | 9.19% | 2.60% | 4.24% | 7.25% | 4.44% | 4.32% | - | - | - | - |
| Benchmark | 1.80% | 5.77% | 13.57% | 5.77% | 12.38% | 6.05% | 3.87% | 6.63% | 5.64% | 5.56% | 5.88% | 6.44% | 5.97% | 7.01% |
| Category Average | 1.96% | 12.03% | 12.03% | 4.49% | 10.15% | 3.31% | 3.22% | 7.67% | 4.79% | 4.62% | 4.52% | 5.09% | 4.15% | 4.67% |
| Category Rank | 1,040 / 1,735 | 831 / 1,735 | 884 / 1,711 | 831 / 1,735 | 1,132 / 1,684 | 1,207 / 1,617 | 477 / 1,434 | 723 / 1,358 | 769 / 1,301 | 672 / 1,166 | - | - | - | - |
| Quartile Ranking | 3 | 2 | 3 | 2 | 3 | 3 | 2 | 3 | 3 | 3 | - | - | - | - |
| Return % | Apr | May | Jun | Jul | Aug | Sep | Oct | Nov | Dec | Jan | Feb | Mar |
|---|---|---|---|---|---|---|---|---|---|---|---|---|
| Fund | 1.66% | -2.96% | 1.77% | 0.49% | -0.55% | -2.91% | -1.26% | 5.48% | 2.79% | 0.06% | 2.75% | 1.84% |
| Benchmark | 1.29% | -1.31% | 0.46% | 1.75% | 0.57% | -3.70% | 0.21% | 5.00% | 2.05% | 0.78% | 3.10% | 1.80% |
5.89% (April 2020)
-8.14% (March 2020)
| Return % | 2014 | 2015 | 2016 | 2017 | 2018 | 2019 | 2020 | 2021 | 2022 | 2023 |
|---|---|---|---|---|---|---|---|---|---|---|
| Fund | - | - | - | - | -3.54% | 11.53% | 3.63% | 12.34% | -8.94% | 7.03% |
| Benchmark | 12.44% | 17.05% | 2.39% | 8.66% | 2.68% | 12.26% | 11.12% | 6.48% | -11.62% | 11.69% |
| Category Average | 7.77% | 2.99% | 5.05% | 7.69% | -3.99% | 13.52% | 7.16% | 9.69% | -11.26% | 9.53% |
| Quartile Ranking | - | - | - | - | 3 | 3 | 4 | 1 | 2 | 4 |
| Category Rank | - | - | - | - | 695/ 1,145 | 885/ 1,257 | 1,146/ 1,344 | 271/ 1,425 | 467/ 1,564 | 1,443/ 1,683 |
12.34% (2021)
-8.94% (2022)
| Name | Percent |
|---|---|
| Canadian Equity | 32.37 |
| US Equity | 26.80 |
| Canadian Corporate Bonds | 15.34 |
| Canadian Government Bonds | 10.13 |
| International Equity | 7.01 |
| Other | 8.35 |
| Name | Percent |
|---|---|
| Fixed Income | 27.86 |
| Mutual Fund | 16.04 |
| Financial Services | 14.42 |
| Energy | 6.51 |
| Technology | 5.75 |
| Other | 29.42 |
| Name | Percent |
|---|---|
| North America | 92.49 |
| Europe | 5.38 |
| Asia | 1.47 |
| Latin America | 0.59 |
| Africa and Middle East | 0.09 |
| Other | -0.02 |
| Name | Percent |
|---|---|
| Canada Life Canadian Core Bond Fund A | 32.21 |
| Canada Life Canadian Dividend Fund A | 25.01 |
| Canada Life U.S. All Cap Growth Fund A | 16.04 |
| Canada Life Canadian Growth Fund A | 12.61 |
| Canada Life US Dividend Fund A | 8.15 |
| Dcc PLC | 0.33 |
| Ryanair Holdings PLC - ADR | 0.32 |
| Samsung Electronics Co Ltd | 0.29 |
| Alcon AG | 0.28 |
| EssilorLuxottica SA | 0.28 |

Canada Life Global Growth and Income Fund A Series
Median
Other - Global Neutral Balanced
| Standard Deviation | 9.21% | 9.26% | - |
|---|---|---|---|
| Beta | 0.92% | 1.02% | - |
| Alpha | 0.01% | -0.01% | - |
| Rsquared | 0.81% | 0.80% | - |
| Sharpe | 0.21% | 0.31% | - |
| Sortino | 0.25% | 0.27% | - |
| Treynor | 0.02% | 0.03% | - |
| Tax Efficiency | 75.96% | 84.63% | - |
| Volatility |

|

|
- |

| Key Ratio | 1 Yr | 3 Yr | 5 Yr | 10 Yr |
|---|---|---|---|---|
| Standard Deviation | 8.55% | 9.21% | 9.26% | - |
| Beta | 1.04% | 0.92% | 1.02% | - |
| Alpha | -0.03% | 0.01% | -0.01% | - |
| Rsquared | 0.84% | 0.81% | 0.80% | - |
| Sharpe | 0.52% | 0.21% | 0.31% | - |
| Sortino | 1.28% | 0.25% | 0.27% | - |
| Treynor | 0.04% | 0.02% | 0.03% | - |
| Tax Efficiency | 97.89% | 75.96% | 84.63% | - |
| Start Date | July 14, 2017 |
|---|---|
| Instrument Type | Mutual Fund |
| Share Class | Commission Based Advice |
| Legal Status | Trust |
| Sales Status | Open |
| Currency | CAD |
| Distribution Frequency | Annual |
| Assets ($mil) | - |
| FundServ Code | Load Code | Sales Status |
|---|---|---|
| MAX1259 | ||
| MAX1359 | ||
| MAX1459 |
The Fund seeks long-term capital growth and income through exposure primarily to equities issued by companies around the world and Canadian fixed income and money market securities. The Fund may obtain this exposure by investing directly in securities, by investing in securities of other investment funds, and/or by using derivatives that provide exposure to such securities or investment funds. Any proposed change to
The Fund’s asset mix will generally be kept within the following ranges: 40% - 70% equity securities, 30% - 60% to fixed income securities, including cash and cash-equivalents. The Fund may be invested outside these ranges at Mackenzie Investments’ discretion. The names of the sub-advisors and their respective asset class are: Mackenzie Investments - Equity (Canadian and U.S.) and Fixed Income; Setanta - Equity (International). Mackenzie Investments and Setanta will select and manage equities.
| Name | Start Date |
|---|---|
| Mackenzie Financial Corporation | 11-30-2022 |
| Canada Life Investment Management Ltd. | 11-30-2022 |
| Setanta Asset Management Limited | 07-18-2023 |
| Fund Manager | Canada Life Investment Management Ltd. |
|---|---|
| Advisor | Canada Life Investment Management Ltd. |
| Custodian | Canadian Imperial Bank of Commerce |
| Registrar | Mackenzie Financial Corporation |
| Distributor | Quadrus Investment Services Limited |
| Auditor | Deloitte LLP |
| RSP Eligible | Yes |
|---|---|
| PAC Allowed | Yes |
| PAC Initial Investment | 25 |
| PAC Subsequent | 25 |
| SWP Allowed | Yes |
| SWP Min Balance | 5,000 |
| SWP Min Withdrawal | 50 |
| MER | 2.46% |
|---|---|
| Management Fee | 2.00% |
| Load | Choice of Front or No Load |
| FE Max | 5.00% |
| DSC Max | - |
| Trailer Fee Max (FE) | - |
| Trailer Fee Max (DSC) | - |
| Trailer Fee Max (NL) | - |
| Trailer Fee Max (LL) | - |
Join Fund Library now and get free access to personalized features to help you manage your investments.
 Fund Library