Join Fund Library now and get free access to personalized features to help you manage your investments.
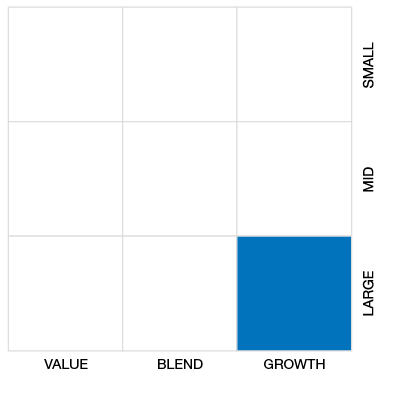
Real Estate Equity
 Click for more information on Fundata’s FundGrade
Click for more information on Fundata’s FundGrade.
 Click for more information on Fundata’s ESG Grade
Click for more information on Fundata’s ESG Grade.
|
NAVPS (05-02-2024) |
$16.16 |
|---|---|
| Change |
$0.09
(0.56%)
|
As at March 31, 2024
As at March 31, 2024
As at February 29, 2024
Inception Return (April 29, 2014): 2.84%
| Row Heading | Return | Annualized Return | ||||||||||||
|---|---|---|---|---|---|---|---|---|---|---|---|---|---|---|
| 1 Mth | 3 Mth | 6 Mth | YTD | 1 Yr | 2 Yr | 3 Yr | 4 Yr | 5 Yr | 6 Yr | 7 Yr | 8 Yr | 9 Yr | 10 Yr | |
| Fund | 0.42% | 1.00% | 10.90% | 1.00% | 0.92% | -9.40% | 0.80% | 6.57% | 1.08% | 3.80% | 2.31% | 2.60% | 1.85% | - |
| Benchmark | 2.80% | 0.06% | 14.73% | 0.06% | 8.93% | -3.29% | 3.38% | 7.36% | 1.37% | 3.87% | 3.14% | 3.10% | 3.30% | 6.15% |
| Category Average | 2.10% | 12.36% | 12.36% | 0.79% | 4.81% | -5.98% | 1.05% | 5.52% | 1.26% | 3.30% | 3.15% | 3.14% | 2.89% | 4.90% |
| Category Rank | 128 / 138 | 77 / 138 | 117 / 138 | 77 / 138 | 119 / 133 | 127 / 131 | 84 / 123 | 31 / 117 | 69 / 115 | 50 / 99 | 81 / 94 | 70 / 93 | 73 / 81 | - |
| Quartile Ranking | 4 | 3 | 4 | 3 | 4 | 4 | 3 | 2 | 3 | 3 | 4 | 4 | 4 | - |
| Return % | Apr | May | Jun | Jul | Aug | Sep | Oct | Nov | Dec | Jan | Feb | Mar |
|---|---|---|---|---|---|---|---|---|---|---|---|---|
| Fund | 0.08% | -3.02% | 1.22% | 0.35% | -2.93% | -4.90% | -4.49% | 6.78% | 7.67% | 0.28% | 0.30% | 0.42% |
| Benchmark | 2.01% | -3.76% | 0.71% | 3.22% | -0.62% | -6.39% | -2.07% | 8.53% | 7.88% | -3.79% | 1.17% | 2.80% |
9.25% (January 2023)
-20.67% (March 2020)
| Return % | 2014 | 2015 | 2016 | 2017 | 2018 | 2019 | 2020 | 2021 | 2022 | 2023 |
|---|---|---|---|---|---|---|---|---|---|---|
| Fund | - | -5.95% | 12.86% | -3.78% | 0.07% | 22.25% | -8.91% | 36.12% | -22.06% | 2.44% |
| Benchmark | 30.89% | 21.00% | 1.59% | 1.40% | 2.74% | 15.42% | -11.04% | 30.68% | -19.44% | 10.39% |
| Category Average | 20.48% | 11.96% | 1.20% | 5.38% | 0.16% | 19.52% | -6.93% | 27.77% | -21.53% | 6.48% |
| Quartile Ranking | - | 4 | 1 | 4 | 3 | 1 | 4 | 1 | 3 | 4 |
| Category Rank | - | 79/ 79 | 12/ 93 | 93/ 94 | 68/ 99 | 20/ 107 | 106/ 117 | 5/ 123 | 65/ 123 | 118/ 133 |
36.12% (2021)
-22.06% (2022)
| Name | Percent |
|---|---|
| Income Trust Units | 59.16 |
| US Equity | 26.12 |
| Canadian Equity | 12.39 |
| Cash and Equivalents | 2.00 |
| Other | 0.33 |
| Name | Percent |
|---|---|
| Real Estate | 86.56 |
| Healthcare | 7.37 |
| Exchange Traded Fund | 1.09 |
| Cash and Cash Equivalent | 0.92 |
| Industrial Services | 0.79 |
| Other | 3.27 |
| Name | Percent |
|---|---|
| North America | 99.68 |
| Multi-National | 0.32 |
| Name | Percent |
|---|---|
| Flagship Communities REIT - Units | 6.26 |
| InterRent REIT - Units | 5.71 |
| Killam Apartment REIT - Units Cl A | 4.62 |
| Chartwell Retirement Residences - Units | 4.30 |
| Granite REIT - Units | 4.12 |
| Dream Industrial REIT - Units | 3.93 |
| Prologis Inc | 3.92 |
| BSR REIT - Units | 3.65 |
| Canadian Apartment Properties REIT - Units | 3.58 |
| Nexus Industrial REIT - Units | 3.53 |

Purpose Real Estate Income Fund Series A
Median
Other - Real Estate Equity
| Standard Deviation | 16.54% | 17.06% | - |
|---|---|---|---|
| Beta | 0.92% | 0.95% | - |
| Alpha | -0.02% | 0.00% | - |
| Rsquared | 0.86% | 0.88% | - |
| Sharpe | -0.03% | 0.04% | - |
| Sortino | -0.08% | -0.03% | - |
| Treynor | -0.01% | 0.01% | - |
| Tax Efficiency | - | - | - |
| Volatility |

|

|
- |

| Key Ratio | 1 Yr | 3 Yr | 5 Yr | 10 Yr |
|---|---|---|---|---|
| Standard Deviation | 13.56% | 16.54% | 17.06% | - |
| Beta | 0.77% | 0.92% | 0.95% | - |
| Alpha | -0.06% | -0.02% | 0.00% | - |
| Rsquared | 0.79% | 0.86% | 0.88% | - |
| Sharpe | -0.22% | -0.03% | 0.04% | - |
| Sortino | -0.15% | -0.08% | -0.03% | - |
| Treynor | -0.04% | -0.01% | 0.01% | - |
| Tax Efficiency | - | - | - | - |
The E, S, and G scores are averaged for each security in the portfolio, to arrive at an ESG score for each security. We take the portfolio weighted average of the ESG scores for each fund and rank them against their peers to arrive at the Fundata ESG Score from 0-100.
Three scores under the Environment bucket are averaged to yield the Fundata Environment Score for each fund from 0-100: (1) Pollution Prevention, (2) Environmental Transparency, (3) Resource Efficiency.
Six scores under the Social bucket are averaged to yield the Fundata Social Score for each fund from 0-100. (1) Compensation and Satisfaction, (2) Diversity and Rights, (3) Education and Work Conditions, (4) Community and Charity, (5) Human Rights, (6) Sustainability Integration.
Three scores under the governance bucket are averaged to yield the Fundata Governance Score for each fund from 0-100: (1) Board Effectiveness, (2) Management Ethics, (3) Disclosure and Accountability.
Powered by OWL Analytics. For more information, please contact Fundata Canada.
| Start Date | April 29, 2014 |
|---|---|
| Instrument Type | Mutual Fund |
| Share Class | Commission Based Advice |
| Legal Status | Corporation |
| Sales Status | Open |
| Currency | CAD |
| Distribution Frequency | Monthly |
| Assets ($mil) | - |
| FundServ Code | Load Code | Sales Status |
|---|---|---|
| PFC800 |
The fund seeks to (i) provide shareholders with long-term capital appreciation by investing in a portfolio of real estate focused equity securities listed on major North American exchanges and (ii) reduce the risk of rising interest rates associated with real estate equity securities by tactically hedging the duration of the portfolio.
The fund uses an active, fundamental approach to investing in real estate equities. The fund will also employ technical analysis to assist in security selection drawing on macroeconomic factors and trends in addition to company-specific growth, equity and value factors. The fund may invest in underlying funds to achieve its investment objectives.
| Name | Start Date |
|---|---|
| Purpose Investments Inc. | 04-29-2014 |
| Fund Manager | Purpose Investments Inc. |
|---|---|
| Advisor | Purpose Investments Inc. |
| Custodian | CIBC Mellon Trust Company |
| Registrar | CIBC Mellon Global Securities Services Company |
| Distributor | - |
| Auditor | Ernst & Young LLP, Chartered Accountants |
| RSP Eligible | Yes |
|---|---|
| PAC Allowed | Yes |
| PAC Initial Investment | 5,000 |
| PAC Subsequent | 100 |
| SWP Allowed | Yes |
| SWP Min Balance | 15,000 |
| SWP Min Withdrawal | 100 |
| MER | 2.10% |
|---|---|
| Management Fee | 1.65% |
| Load | Back Fee Only |
| FE Max | 5.00% |
| DSC Max | - |
| Trailer Fee Max (FE) | 1.00% |
| Trailer Fee Max (DSC) | - |
| Trailer Fee Max (NL) | - |
| Trailer Fee Max (LL) | - |
Join Fund Library now and get free access to personalized features to help you manage your investments.
 Fund Library