Join Fund Library now and get free access to personalized features to help you manage your investments.
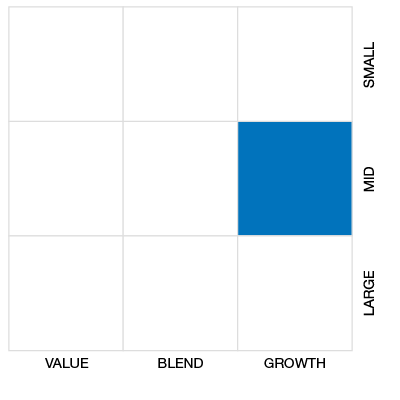
Cdn Foc Small/Mid Cap Eq
 Click for more information on Fundata’s FundGrade
Click for more information on Fundata’s FundGrade.
 Click for more information on Fundata’s ESG Grade
Click for more information on Fundata’s ESG Grade.

2012
Click for more information on Fundata’s FundGrade
|
NAVPS (05-01-2024) |
$12.50 |
|---|---|
| Change |
$0.01
(0.09%)
|
As at March 31, 2024
As at January 31, 2024
As at February 29, 2024
Inception Return (April 28, 1997): 6.81%
| Row Heading | Return | Annualized Return | ||||||||||||
|---|---|---|---|---|---|---|---|---|---|---|---|---|---|---|
| 1 Mth | 3 Mth | 6 Mth | YTD | 1 Yr | 2 Yr | 3 Yr | 4 Yr | 5 Yr | 6 Yr | 7 Yr | 8 Yr | 9 Yr | 10 Yr | |
| Fund | 1.65% | 6.66% | 13.77% | 6.66% | 4.45% | -2.20% | 0.57% | 8.24% | 3.07% | 2.54% | 2.42% | 4.22% | 3.35% | 4.05% |
| Benchmark | 6.22% | 7.87% | 15.65% | 7.87% | 11.58% | 0.96% | 4.53% | 20.26% | 8.17% | 6.65% | 5.62% | 8.00% | 6.54% | 5.76% |
| Category Average | 3.35% | 16.52% | 16.52% | 8.19% | 12.63% | 2.82% | 2.99% | 17.63% | 9.94% | 8.76% | 8.17% | 9.31% | 7.63% | 7.33% |
| Category Rank | 47 / 52 | 41 / 52 | 46 / 52 | 41 / 52 | 47 / 52 | 52 / 52 | 47 / 52 | 52 / 52 | 49 / 49 | 40 / 40 | 33 / 33 | 32 / 32 | 30 / 31 | 22 / 25 |
| Quartile Ranking | 4 | 4 | 4 | 4 | 4 | 4 | 4 | 4 | 4 | 4 | 4 | 4 | 4 | 4 |
| Return % | Apr | May | Jun | Jul | Aug | Sep | Oct | Nov | Dec | Jan | Feb | Mar |
|---|---|---|---|---|---|---|---|---|---|---|---|---|
| Fund | -0.26% | -3.03% | 1.80% | -0.87% | -0.71% | -5.26% | -3.11% | 6.15% | 3.72% | 1.62% | 3.26% | 1.65% |
| Benchmark | -0.62% | -3.64% | 1.79% | 5.38% | -1.04% | -5.08% | -2.79% | 5.65% | 4.40% | -0.78% | 2.34% | 6.22% |
15.49% (February 2000)
-22.12% (November 2000)
| Return % | 2014 | 2015 | 2016 | 2017 | 2018 | 2019 | 2020 | 2021 | 2022 | 2023 |
|---|---|---|---|---|---|---|---|---|---|---|
| Fund | 8.55% | -4.07% | 20.47% | 8.63% | -11.73% | 17.84% | 3.59% | 17.57% | -17.31% | 1.50% |
| Benchmark | 1.95% | -3.54% | 27.23% | 7.15% | -14.41% | 17.42% | 12.92% | 18.74% | -10.51% | 8.17% |
| Category Average | 6.09% | -2.19% | 16.27% | 9.79% | -11.20% | 21.83% | 30.06% | 13.94% | -13.64% | 7.90% |
| Quartile Ranking | 3 | 4 | 2 | 3 | 4 | 4 | 4 | 4 | 4 | 4 |
| Category Rank | 17/ 25 | 25/ 29 | 11/ 32 | 19/ 33 | 32/ 40 | 36/ 43 | 46/ 52 | 43/ 52 | 47/ 52 | 50/ 52 |
20.47% (2016)
-17.31% (2022)
| Name | Percent |
|---|---|
| Canadian Equity | 52.16 |
| US Equity | 26.55 |
| Cash and Equivalents | 9.68 |
| Income Trust Units | 8.45 |
| International Equity | 1.32 |
| Other | 1.84 |
| Name | Percent |
|---|---|
| Real Estate | 17.22 |
| Consumer Services | 15.74 |
| Consumer Goods | 13.67 |
| Cash and Cash Equivalent | 9.68 |
| Financial Services | 7.70 |
| Other | 35.99 |
| Name | Percent |
|---|---|
| North America | 96.83 |
| Multi-National | 1.84 |
| Asia | 1.07 |
| Europe | 0.25 |
| Other | 0.01 |
| Name | Percent |
|---|---|
| John Hancock Lfe Insrnc Co USA 7.38% 15-Feb-2024 | 4.83 |
| Spin Master Corp | 4.65 |
| Jamieson Wellness Inc | 4.56 |
| FirstService Corp | 4.03 |
| Cash and Cash Equivalents | 3.46 |
| Brown & Brown Inc | 3.23 |
| Killam Apartment REIT - Units | 3.07 |
| Donaldson Co Inc | 3.05 |
| Boyd Group Services Inc | 2.97 |
| Kinaxis Inc | 2.80 |

Dynamic Small Business Fund Series A
Median
Other - Cdn Foc Small/Mid Cap Eq
| Standard Deviation | 12.87% | 14.58% | 11.58% |
|---|---|---|---|
| Beta | 0.69% | 0.61% | 0.58% |
| Alpha | -0.02% | -0.02% | 0.01% |
| Rsquared | 0.67% | 0.79% | 0.74% |
| Sharpe | -0.10% | 0.15% | 0.28% |
| Sortino | -0.17% | 0.10% | 0.19% |
| Treynor | -0.02% | 0.04% | 0.06% |
| Tax Efficiency | - | 62.84% | 72.39% |
| Volatility |

|
|

|

| Key Ratio | 1 Yr | 3 Yr | 5 Yr | 10 Yr |
|---|---|---|---|---|
| Standard Deviation | 11.28% | 12.87% | 14.58% | 11.58% |
| Beta | 0.66% | 0.69% | 0.61% | 0.58% |
| Alpha | -0.03% | -0.02% | -0.02% | 0.01% |
| Rsquared | 0.61% | 0.67% | 0.79% | 0.74% |
| Sharpe | 0.02% | -0.10% | 0.15% | 0.28% |
| Sortino | 0.26% | -0.17% | 0.10% | 0.19% |
| Treynor | 0.00% | -0.02% | 0.04% | 0.06% |
| Tax Efficiency | 85.17% | - | 62.84% | 72.39% |
The E, S, and G scores are averaged for each security in the portfolio, to arrive at an ESG score for each security. We take the portfolio weighted average of the ESG scores for each fund and rank them against their peers to arrive at the Fundata ESG Score from 0-100.
Three scores under the Environment bucket are averaged to yield the Fundata Environment Score for each fund from 0-100: (1) Pollution Prevention, (2) Environmental Transparency, (3) Resource Efficiency.
Six scores under the Social bucket are averaged to yield the Fundata Social Score for each fund from 0-100. (1) Compensation and Satisfaction, (2) Diversity and Rights, (3) Education and Work Conditions, (4) Community and Charity, (5) Human Rights, (6) Sustainability Integration.
Three scores under the governance bucket are averaged to yield the Fundata Governance Score for each fund from 0-100: (1) Board Effectiveness, (2) Management Ethics, (3) Disclosure and Accountability.
Powered by OWL Analytics. For more information, please contact Fundata Canada.
| Start Date | April 28, 1997 |
|---|---|
| Instrument Type | Mutual Fund |
| Share Class | Commission Based Advice |
| Legal Status | Trust |
| Sales Status | Open |
| Currency | CAD |
| Distribution Frequency | Monthly |
| Assets ($mil) | $848 |
| FundServ Code | Load Code | Sales Status |
|---|---|---|
| DYN087 | ||
| DYN1787 | ||
| DYN1788 | ||
| DYN1789 | ||
| DYN587 | ||
| DYN687 | ||
| DYN7016 | ||
| DYN787 |
Dynamic Small Business Fund seeks to achieve long-term capital appreciation and income through investment primarily in equity securities of relatively small Canadian businesses. Before a fundamental change is made to the investment objective of the Fund, the prior approval of unitholders is required. This approval must be given by a resolution passed by a majority of the votes cast at a meeting of unitholders.
The Fund invests primarily in securities of publicly traded, relatively small Canadian businesses, including dividend or distribution paying businesses, including investment trusts. The Fund may also include similar investments in mid-capitalization businesses. The Fund generally follows an investment approach emphasizing a suitably diversified portfolio of different businesses that meet required objectives.
| Name | Start Date |
|---|---|
| Oscar Belaiche | 08-08-2002 |
| Steven Hall | 01-02-2014 |
| Tom Dicker | 01-02-2014 |
| Fund Manager | 1832 Asset Management L.P. |
|---|---|
| Advisor | 1832 Asset Management L.P. |
| Custodian | State Street Trust Company Canada |
| Registrar | 1832 Asset Management L.P. |
| Distributor | 1832 Asset Management L.P. |
| Auditor | KPMG LLP |
| RSP Eligible | Yes |
|---|---|
| PAC Allowed | Yes |
| PAC Initial Investment | 100 |
| PAC Subsequent | 100 |
| SWP Allowed | Yes |
| SWP Min Balance | 5,000 |
| SWP Min Withdrawal | 100 |
| MER | 2.42% |
|---|---|
| Management Fee | 2.00% |
| Load | Choice of Front or No Load |
| FE Max | 5.00% |
| DSC Max | 6.00% |
| Trailer Fee Max (FE) | 1.00% |
| Trailer Fee Max (DSC) | 0.50% |
| Trailer Fee Max (NL) | - |
| Trailer Fee Max (LL) | - |
Join Fund Library now and get free access to personalized features to help you manage your investments.
 Fund Library