Join Fund Library now and get free access to personalized features to help you manage your investments.
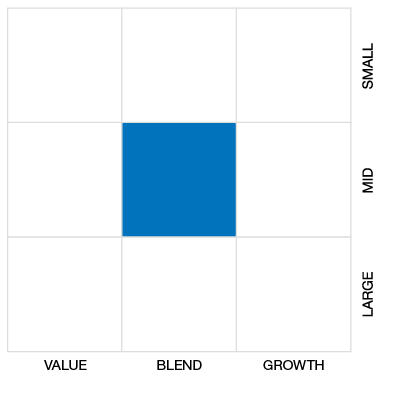
Cdn Foc Small/Mid Cap Eq
 Click for more information on Fundata’s FundGrade
Click for more information on Fundata’s FundGrade.
 Click for more information on Fundata’s ESG Grade
Click for more information on Fundata’s ESG Grade.
|
NAVPS (04-30-2024) |
$13.06 |
|---|---|
| Change |
-$0.26
(-1.95%)
|
As at March 31, 2024
As at March 31, 2024
As at February 29, 2024
Inception Return (September 12, 2017): 5.37%
| Row Heading | Return | Annualized Return | ||||||||||||
|---|---|---|---|---|---|---|---|---|---|---|---|---|---|---|
| 1 Mth | 3 Mth | 6 Mth | YTD | 1 Yr | 2 Yr | 3 Yr | 4 Yr | 5 Yr | 6 Yr | 7 Yr | 8 Yr | 9 Yr | 10 Yr | |
| Fund | 3.63% | 4.49% | 13.99% | 4.49% | 15.26% | 6.46% | 5.78% | 14.72% | 6.42% | 5.13% | - | - | - | - |
| Benchmark | 6.22% | 7.87% | 15.65% | 7.87% | 11.58% | 0.96% | 4.53% | 20.26% | 8.17% | 6.65% | 5.62% | 8.00% | 6.54% | 5.76% |
| Category Average | 3.35% | 16.52% | 16.52% | 8.19% | 12.63% | 2.82% | 2.99% | 17.63% | 9.94% | 8.76% | 8.17% | 9.31% | 7.63% | 7.33% |
| Category Rank | 15 / 52 | 47 / 52 | 43 / 52 | 47 / 52 | 32 / 52 | 18 / 52 | 21 / 52 | 38 / 52 | 41 / 49 | 32 / 40 | - | - | - | - |
| Quartile Ranking | 2 | 4 | 4 | 4 | 3 | 2 | 2 | 3 | 4 | 4 | - | - | - | - |
| Return % | Apr | May | Jun | Jul | Aug | Sep | Oct | Nov | Dec | Jan | Feb | Mar |
|---|---|---|---|---|---|---|---|---|---|---|---|---|
| Fund | -0.87% | -1.94% | 4.57% | 4.30% | -1.90% | -2.79% | -3.23% | 5.24% | 7.12% | -1.10% | 1.96% | 3.63% |
| Benchmark | -0.62% | -3.64% | 1.79% | 5.38% | -1.04% | -5.08% | -2.79% | 5.65% | 4.40% | -0.78% | 2.34% | 6.22% |
8.98% (April 2020)
-21.90% (March 2020)
| Return % | 2014 | 2015 | 2016 | 2017 | 2018 | 2019 | 2020 | 2021 | 2022 | 2023 |
|---|---|---|---|---|---|---|---|---|---|---|
| Fund | - | - | - | - | -11.71% | 19.28% | -2.52% | 17.91% | -9.36% | 16.23% |
| Benchmark | 1.95% | -3.54% | 27.23% | 7.15% | -14.41% | 17.42% | 12.92% | 18.74% | -10.51% | 8.17% |
| Category Average | 6.09% | -2.19% | 16.27% | 9.79% | -11.20% | 21.83% | 30.06% | 13.94% | -13.64% | 7.90% |
| Quartile Ranking | - | - | - | - | 4 | 3 | 4 | 4 | 2 | 1 |
| Category Rank | - | - | - | - | 31/ 40 | 26/ 43 | 52/ 52 | 41/ 52 | 14/ 52 | 7/ 52 |
19.28% (2019)
-11.71% (2018)
| Name | Percent |
|---|---|
| Canadian Equity | 48.75 |
| US Equity | 47.75 |
| International Equity | 3.07 |
| Cash and Equivalents | 0.44 |
| Other | -0.01 |
| Name | Percent |
|---|---|
| Energy | 17.14 |
| Basic Materials | 14.57 |
| Consumer Services | 10.09 |
| Consumer Goods | 9.46 |
| Real Estate | 9.28 |
| Other | 39.46 |
| Name | Percent |
|---|---|
| North America | 96.94 |
| Latin America | 2.56 |
| Europe | 0.45 |
| Asia | 0.06 |
| Other | -0.01 |
| Name | Percent |
|---|---|
| Enerplus Corp | 2.11 |
| Air Canada | 1.84 |
| TFI International Inc | 1.82 |
| Toromont Industries Ltd | 1.79 |
| Cal-Maine Foods Inc | 1.77 |
| Gibson Energy Inc | 1.68 |
| iA Financial Corp Inc | 1.68 |
| Stantec Inc | 1.68 |
| Dundee Precious Metals Inc | 1.66 |
| Russel Metals Inc | 1.66 |

TD North American Small-Cap Equity Fund - Investor Series
Median
Other - Cdn Foc Small/Mid Cap Eq
| Standard Deviation | 14.51% | 17.09% | - |
|---|---|---|---|
| Beta | 0.84% | 0.72% | - |
| Alpha | 0.02% | 0.00% | - |
| Rsquared | 0.79% | 0.82% | - |
| Sharpe | 0.28% | 0.34% | - |
| Sortino | 0.39% | 0.37% | - |
| Treynor | 0.05% | 0.08% | - |
| Tax Efficiency | 93.88% | 95.78% | - |
| Volatility |

|
|
- |

| Key Ratio | 1 Yr | 3 Yr | 5 Yr | 10 Yr |
|---|---|---|---|---|
| Standard Deviation | 12.50% | 14.51% | 17.09% | - |
| Beta | 0.84% | 0.84% | 0.72% | - |
| Alpha | 0.05% | 0.02% | 0.00% | - |
| Rsquared | 0.81% | 0.79% | 0.82% | - |
| Sharpe | 0.82% | 0.28% | 0.34% | - |
| Sortino | 2.06% | 0.39% | 0.37% | - |
| Treynor | 0.12% | 0.05% | 0.08% | - |
| Tax Efficiency | 98.19% | 93.88% | 95.78% | - |
The E, S, and G scores are averaged for each security in the portfolio, to arrive at an ESG score for each security. We take the portfolio weighted average of the ESG scores for each fund and rank them against their peers to arrive at the Fundata ESG Score from 0-100.
Three scores under the Environment bucket are averaged to yield the Fundata Environment Score for each fund from 0-100: (1) Pollution Prevention, (2) Environmental Transparency, (3) Resource Efficiency.
Six scores under the Social bucket are averaged to yield the Fundata Social Score for each fund from 0-100. (1) Compensation and Satisfaction, (2) Diversity and Rights, (3) Education and Work Conditions, (4) Community and Charity, (5) Human Rights, (6) Sustainability Integration.
Three scores under the governance bucket are averaged to yield the Fundata Governance Score for each fund from 0-100: (1) Board Effectiveness, (2) Management Ethics, (3) Disclosure and Accountability.
Powered by OWL Analytics. For more information, please contact Fundata Canada.
| Start Date | September 12, 2017 |
|---|---|
| Instrument Type | Mutual Fund |
| Share Class | Commission Based Advice |
| Legal Status | Trust |
| Sales Status | Open |
| Currency | CAD |
| Distribution Frequency | Annual |
| Assets ($mil) | $585 |
| FundServ Code | Load Code | Sales Status |
|---|---|---|
| TDB3310 |
The fundamental investment objective is to seek to achieve long-term capital growth by investing primarily in equity securities of small or medium-sized issuers in North America. The fundamental investment objective may only be changed with the approval of a majority of unitholders, given at a meeting called for that purpose.
The portfolio adviser seeks to achieve the fundamental investment objective of the Fund by utilizing a quantitative equity strategy that exploits market inefficiencies related to the pricing and valuations of securities in order to add value. This strategy will generally result in a portfolio of investments in a large number of securities, broadly diversified across all sectors of the S&P/TSX Completion and S&P 600 indices.
| Name | Start Date |
|---|---|
| Jean Masson | 09-12-2017 |
| Julien Palardy | 09-12-2017 |
| Laurie-Anne Davison | 05-01-2019 |
| Emin Baghramyan | 05-01-2019 |
| Louis-Philippe Roy | 05-01-2019 |
| Fund Manager | TD Asset Management Inc. |
|---|---|
| Advisor | TD Asset Management Inc. |
| Custodian | CIBC Mellon Trust Company |
| Registrar | The Toronto-Dominion Bank |
| Distributor | TD Investment Services Inc |
| Auditor | Ernst & Young LLP |
| RSP Eligible | Yes |
|---|---|
| PAC Allowed | Yes |
| PAC Initial Investment | - |
| PAC Subsequent | - |
| SWP Allowed | Yes |
| SWP Min Balance | 10,000 |
| SWP Min Withdrawal | 100 |
| MER | 2.25% |
|---|---|
| Management Fee | 1.80% |
| Load | No Load |
| FE Max | - |
| DSC Max | - |
| Trailer Fee Max (FE) | - |
| Trailer Fee Max (DSC) | - |
| Trailer Fee Max (NL) | 1.00% |
| Trailer Fee Max (LL) | - |
Join Fund Library now and get free access to personalized features to help you manage your investments.
 Fund Library