Join Fund Library now and get free access to personalized features to help you manage your investments.
European Equity
 Click for more information on Fundata’s FundGrade
Click for more information on Fundata’s FundGrade.
 Click for more information on Fundata’s ESG Grade
Click for more information on Fundata’s ESG Grade.
|
NAVPS (04-30-2024) |
$42.36 |
|---|---|
| Change |
-$0.07
(-0.15%)
|
As at March 31, 2024
As at December 31, 2023
As at February 29, 2024
Inception Return (June 01, 1992): 5.91%
| Row Heading | Return | Annualized Return | ||||||||||||
|---|---|---|---|---|---|---|---|---|---|---|---|---|---|---|
| 1 Mth | 3 Mth | 6 Mth | YTD | 1 Yr | 2 Yr | 3 Yr | 4 Yr | 5 Yr | 6 Yr | 7 Yr | 8 Yr | 9 Yr | 10 Yr | |
| Fund | 3.11% | 4.48% | 10.27% | 4.48% | 11.17% | 8.55% | 3.99% | 8.96% | 3.25% | 2.49% | 3.57% | 3.93% | 2.64% | 2.98% |
| Benchmark | 3.63% | 7.29% | 17.28% | 7.29% | 14.30% | 11.36% | 8.05% | 13.27% | 8.07% | 6.59% | 7.35% | 7.94% | 6.40% | 6.69% |
| Category Average | 2.61% | 15.55% | 15.55% | 5.64% | 12.75% | 8.91% | 4.30% | 10.68% | 5.21% | 3.89% | 4.68% | 4.89% | 4.14% | 4.29% |
| Category Rank | 46 / 112 | 78 / 112 | 109 / 112 | 78 / 112 | 80 / 112 | 61 / 112 | 62 / 111 | 92 / 109 | 102 / 109 | 88 / 102 | 83 / 95 | 60 / 82 | 73 / 78 | 63 / 70 |
| Quartile Ranking | 2 | 3 | 4 | 3 | 3 | 3 | 3 | 4 | 4 | 4 | 4 | 3 | 4 | 4 |
| Return % | Apr | May | Jun | Jul | Aug | Sep | Oct | Nov | Dec | Jan | Feb | Mar |
|---|---|---|---|---|---|---|---|---|---|---|---|---|
| Fund | 5.50% | -5.23% | 2.04% | 1.80% | 0.27% | -3.19% | -3.52% | 7.70% | 1.57% | -0.02% | 1.35% | 3.11% |
| Benchmark | 4.33% | -5.65% | 2.01% | 2.73% | -1.44% | -4.13% | -1.41% | 7.87% | 2.78% | 0.64% | 2.87% | 3.63% |
12.88% (November 2020)
-18.63% (September 2008)
| Return % | 2014 | 2015 | 2016 | 2017 | 2018 | 2019 | 2020 | 2021 | 2022 | 2023 |
|---|---|---|---|---|---|---|---|---|---|---|
| Fund | -3.97% | 18.98% | -10.92% | 16.20% | -8.67% | 15.06% | -2.43% | 10.06% | -12.87% | 14.25% |
| Benchmark | 3.06% | 17.20% | -3.54% | 18.15% | -7.68% | 19.54% | 3.59% | 15.26% | -10.82% | 17.51% |
| Category Average | -0.81% | 17.33% | -5.77% | 14.98% | -9.04% | 15.21% | 3.84% | 11.84% | -15.77% | 16.91% |
| Quartile Ranking | 4 | 2 | 4 | 2 | 2 | 3 | 4 | 4 | 2 | 4 |
| Category Rank | 59/ 68 | 35/ 78 | 72/ 82 | 45/ 93 | 45/ 101 | 71/ 106 | 92/ 109 | 96/ 111 | 43/ 112 | 94/ 112 |
18.98% (2015)
-12.87% (2022)
| Name | Percent |
|---|---|
| International Equity | 98.52 |
| US Equity | 0.90 |
| Cash and Equivalents | 0.59 |
| Other | -0.01 |
| Name | Percent |
|---|---|
| Consumer Goods | 24.18 |
| Financial Services | 19.99 |
| Healthcare | 11.30 |
| Consumer Services | 10.67 |
| Technology | 9.78 |
| Other | 24.08 |
| Name | Percent |
|---|---|
| Europe | 97.92 |
| North America | 1.51 |
| Other | 0.57 |
| Name | Percent |
|---|---|
| Roche Holding AG - Partcptn | - |
| National Grid PLC | - |
| Industria de Diseno Textil SA | - |
| Telefonaktiebolaget LM Ericsson Cl B | - |
| Reckitt Benckiser Group PLC | - |
| Sanofi SA | - |
| Koninklijke Ahold Delhaize NV | - |
| Associated British Foods PLC | - |
| Sap SE | - |
| British American Tobacco PLC | - |
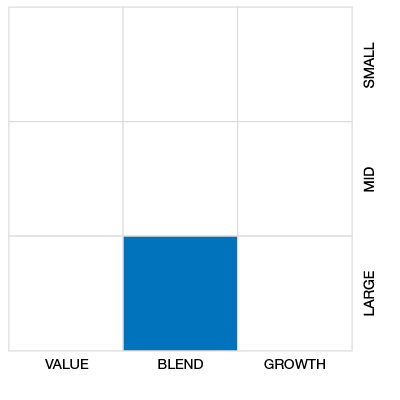

Fidelity Europe Fund Series B
Median
Other - European Equity
| Standard Deviation | 13.94% | 15.83% | 14.07% |
|---|---|---|---|
| Beta | 0.89% | 0.98% | 0.98% |
| Alpha | -0.03% | -0.04% | -0.03% |
| Rsquared | 0.90% | 0.92% | 0.92% |
| Sharpe | 0.16% | 0.16% | 0.18% |
| Sortino | 0.20% | 0.13% | 0.09% |
| Treynor | 0.03% | 0.03% | 0.03% |
| Tax Efficiency | 91.41% | 88.68% | 91.06% |
| Volatility |

|
|

|

| Key Ratio | 1 Yr | 3 Yr | 5 Yr | 10 Yr |
|---|---|---|---|---|
| Standard Deviation | 12.80% | 13.94% | 15.83% | 14.07% |
| Beta | 0.93% | 0.89% | 0.98% | 0.98% |
| Alpha | -0.02% | -0.03% | -0.04% | -0.03% |
| Rsquared | 0.91% | 0.90% | 0.92% | 0.92% |
| Sharpe | 0.52% | 0.16% | 0.16% | 0.18% |
| Sortino | 1.12% | 0.20% | 0.13% | 0.09% |
| Treynor | 0.07% | 0.03% | 0.03% | 0.03% |
| Tax Efficiency | 95.22% | 91.41% | 88.68% | 91.06% |
The E, S, and G scores are averaged for each security in the portfolio, to arrive at an ESG score for each security. We take the portfolio weighted average of the ESG scores for each fund and rank them against their peers to arrive at the Fundata ESG Score from 0-100.
Three scores under the Environment bucket are averaged to yield the Fundata Environment Score for each fund from 0-100: (1) Pollution Prevention, (2) Environmental Transparency, (3) Resource Efficiency.
Six scores under the Social bucket are averaged to yield the Fundata Social Score for each fund from 0-100. (1) Compensation and Satisfaction, (2) Diversity and Rights, (3) Education and Work Conditions, (4) Community and Charity, (5) Human Rights, (6) Sustainability Integration.
Three scores under the governance bucket are averaged to yield the Fundata Governance Score for each fund from 0-100: (1) Board Effectiveness, (2) Management Ethics, (3) Disclosure and Accountability.
Powered by OWL Analytics. For more information, please contact Fundata Canada.
| Start Date | June 01, 1992 |
|---|---|
| Instrument Type | Mutual Fund |
| Share Class | Commission Based Advice |
| Legal Status | Trust |
| Sales Status | Open |
| Currency | CAD |
| Distribution Frequency | Annual |
| Assets ($mil) | $75 |
| FundServ Code | Load Code | Sales Status |
|---|---|---|
| FID228 |
The Fund aims to achieve long-term capital growth. It invests primarily in equity securities of companies in the United Kingdom and continental Europe, including the European Union and the European Free Trade Association.
To meet the Fund’s objectives, the portfolio management team: When buying and selling equity securities, may consider factors about a company, including: > Financial condition. > Industry position. > Economic and market conditions. > Growth potential. > Earnings estimates. > Quality of management. May, by situation, consider ESG criteria when evaluating investment opportunities. The Fund may also: Invest in companies of any size. Invest in China A-Shares.
| Name | Start Date |
|---|---|
| Matthew Siddle | 03-22-2017 |
| Helen Powell | 02-21-2020 |
| FIL Limited | 02-06-2023 |
| Fund Manager | Fidelity Investments Canada ULC |
|---|---|
| Advisor | Fidelity Investments Canada ULC |
| Custodian | CIBC Mellon Trust Company |
| Registrar | Fidelity Investments Canada ULC |
| Distributor | Fidelity Investments Canada ULC |
| Auditor | PriceWaterhouseCoopers LLP |
| RSP Eligible | Yes |
|---|---|
| PAC Allowed | Yes |
| PAC Initial Investment | 500 |
| PAC Subsequent | 25 |
| SWP Allowed | Yes |
| SWP Min Balance | 5,000 |
| SWP Min Withdrawal | 50 |
| MER | 2.24% |
|---|---|
| Management Fee | 1.85% |
| Load | Back Fee Only |
| FE Max | 5.00% |
| DSC Max | - |
| Trailer Fee Max (FE) | 1.00% |
| Trailer Fee Max (DSC) | - |
| Trailer Fee Max (NL) | - |
| Trailer Fee Max (LL) | - |
Join Fund Library now and get free access to personalized features to help you manage your investments.
 Fund Library