Join Fund Library now and get free access to personalized features to help you manage your investments.
Greater China Equity
 Click for more information on Fundata’s FundGrade
Click for more information on Fundata’s FundGrade.
 Click for more information on Fundata’s ESG Grade
Click for more information on Fundata’s ESG Grade.
|
NAVPS (04-30-2024) |
$23.94 |
|---|---|
| Change |
$0.06
(0.24%)
|
As at March 31, 2024
As at February 29, 2024
As at February 29, 2024
Inception Return (May 31, 2004): 4.28%
| Row Heading | Return | Annualized Return | ||||||||||||
|---|---|---|---|---|---|---|---|---|---|---|---|---|---|---|
| 1 Mth | 3 Mth | 6 Mth | YTD | 1 Yr | 2 Yr | 3 Yr | 4 Yr | 5 Yr | 6 Yr | 7 Yr | 8 Yr | 9 Yr | 10 Yr | |
| Fund | 0.01% | 1.81% | -5.97% | 1.81% | -19.14% | -13.72% | -19.32% | -8.74% | -7.41% | -7.18% | -2.73% | -0.22% | -2.24% | 1.43% |
| Benchmark | -0.38% | -1.58% | -5.53% | -1.58% | -19.39% | -10.99% | -8.74% | -1.61% | -2.78% | -3.37% | -2.17% | -1.79% | -3.70% | 4.40% |
| Category Average | 0.99% | -4.61% | -4.61% | 1.35% | -18.61% | -9.31% | -14.21% | -4.99% | -5.15% | -4.53% | -0.43% | 2.12% | 0.23% | 3.26% |
| Category Rank | 56 / 71 | 34 / 71 | 58 / 71 | 34 / 71 | 59 / 69 | 67 / 69 | 61 / 64 | 55 / 59 | 54 / 58 | 49 / 53 | 32 / 36 | 31 / 35 | 31 / 35 | 31 / 35 |
| Quartile Ranking | 4 | 2 | 4 | 2 | 4 | 4 | 4 | 4 | 4 | 4 | 4 | 4 | 4 | 4 |
| Return % | Apr | May | Jun | Jul | Aug | Sep | Oct | Nov | Dec | Jan | Feb | Mar |
|---|---|---|---|---|---|---|---|---|---|---|---|---|
| Fund | -5.43% | -8.78% | 1.77% | 7.12% | -5.04% | -3.70% | -2.88% | 0.80% | -5.65% | -6.48% | 8.85% | 0.01% |
| Benchmark | -1.67% | -6.54% | -3.73% | 3.41% | -5.05% | -1.77% | -0.05% | 0.23% | -4.18% | -11.24% | 11.30% | -0.38% |
22.89% (November 2022)
-21.21% (January 2008)
| Return % | 2014 | 2015 | 2016 | 2017 | 2018 | 2019 | 2020 | 2021 | 2022 | 2023 |
|---|---|---|---|---|---|---|---|---|---|---|
| Fund | 18.31% | 9.24% | -6.04% | 40.29% | -14.56% | 15.58% | 32.93% | -21.10% | -23.44% | -19.20% |
| Benchmark | 56.37% | 39.34% | -22.11% | 5.92% | -27.74% | 25.82% | 26.06% | 7.65% | -21.94% | -12.56% |
| Category Average | 13.37% | 10.12% | -0.54% | 36.44% | -10.53% | 17.64% | 16.11% | -9.03% | -16.98% | -15.56% |
| Quartile Ranking | 3 | 4 | 4 | 1 | 3 | 3 | 3 | 4 | 4 | 4 |
| Category Rank | 22/ 35 | 32/ 35 | 34/ 35 | 7/ 36 | 36/ 52 | 32/ 57 | 30/ 59 | 59/ 64 | 63/ 69 | 61/ 69 |
40.29% (2017)
-23.44% (2022)
| Name | Percent |
|---|---|
| International Equity | 93.54 |
| Cash and Equivalents | 6.45 |
| Other | 0.01 |
| Name | Percent |
|---|---|
| Technology | 38.27 |
| Financial Services | 12.74 |
| Consumer Services | 9.77 |
| Consumer Goods | 8.20 |
| Cash and Cash Equivalent | 6.46 |
| Other | 24.56 |
| Name | Percent |
|---|---|
| Asia | 93.93 |
| North America | 6.07 |
| Name | Percent |
|---|---|
| Alibaba Group Holding Ltd | 9.66 |
| Tencent Holdings Ltd | 9.16 |
| NetEase Inc | 7.46 |
| Canadian Dollar | 6.07 |
| Pinduoduo Inc - ADR | 5.63 |
| China Construction Bank Corp Cl H | 5.35 |
| New Oriental Education & Tech Grp Inc | 5.06 |
| Kweichow Moutai Co Ltd Cl A | 4.86 |
| PetroChina Co Ltd Cl H | 4.27 |
| Trip.com Group Ltd | 2.74 |

RBC Indigo Chinese Equity Fund Investor Series
Median
Other - Greater China Equity
| Standard Deviation | 24.65% | 22.44% | 20.23% |
|---|---|---|---|
| Beta | 0.90% | 0.88% | 0.62% |
| Alpha | -0.12% | -0.04% | -0.01% |
| Rsquared | 0.51% | 0.53% | 0.49% |
| Sharpe | -0.85% | -0.32% | 0.10% |
| Sortino | -1.11% | -0.49% | 0.03% |
| Treynor | -0.23% | -0.08% | 0.03% |
| Tax Efficiency | - | - | 96.98% |
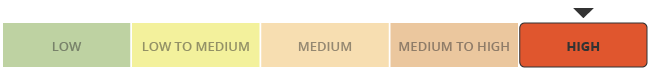
| Volatility |

|
|
|
| Key Ratio | 1 Yr | 3 Yr | 5 Yr | 10 Yr |
|---|---|---|---|---|
| Standard Deviation | 18.95% | 24.65% | 22.44% | 20.23% |
| Beta | 0.83% | 0.90% | 0.88% | 0.62% |
| Alpha | -0.03% | -0.12% | -0.04% | -0.01% |
| Rsquared | 0.71% | 0.51% | 0.53% | 0.49% |
| Sharpe | -1.27% | -0.85% | -0.32% | 0.10% |
| Sortino | -1.43% | -1.11% | -0.49% | 0.03% |
| Treynor | -0.29% | -0.23% | -0.08% | 0.03% |
| Tax Efficiency | - | - | - | 96.98% |
The E, S, and G scores are averaged for each security in the portfolio, to arrive at an ESG score for each security. We take the portfolio weighted average of the ESG scores for each fund and rank them against their peers to arrive at the Fundata ESG Score from 0-100.
Three scores under the Environment bucket are averaged to yield the Fundata Environment Score for each fund from 0-100: (1) Pollution Prevention, (2) Environmental Transparency, (3) Resource Efficiency.
Six scores under the Social bucket are averaged to yield the Fundata Social Score for each fund from 0-100. (1) Compensation and Satisfaction, (2) Diversity and Rights, (3) Education and Work Conditions, (4) Community and Charity, (5) Human Rights, (6) Sustainability Integration.
Three scores under the governance bucket are averaged to yield the Fundata Governance Score for each fund from 0-100: (1) Board Effectiveness, (2) Management Ethics, (3) Disclosure and Accountability.
Powered by OWL Analytics. For more information, please contact Fundata Canada.
| Start Date | May 31, 2004 |
|---|---|
| Instrument Type | Mutual Fund |
| Share Class | Commission Based Advice |
| Legal Status | Trust |
| Sales Status | Open |
| Currency | CAD |
| Distribution Frequency | Annual |
| Assets ($mil) | $109 |
| FundServ Code | Load Code | Sales Status |
|---|---|---|
| HKB517 |
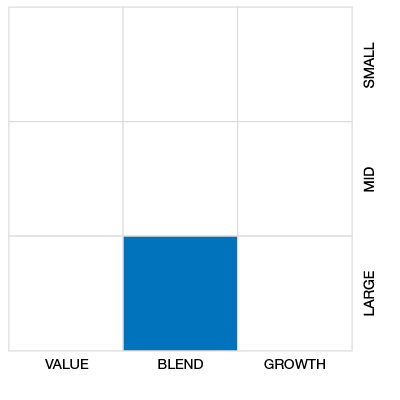
The fundamental investment objective of this Fund is to provide long-term capital growth by investing primarily in a diversified portfolio of equity and equity-related securities of publicly traded companies registered, or with an official listing, on a stock exchange in the People’s Republic of China, as well as investing in securities of public companies that have a significant business or investment link with China.
The Fund will invest primarily in equity securities issued by large, actively traded companies. The portfolio may also include securities in appropriate smaller companies and equity-related securities including, but not limited to, Chinese warrants and participation notes.
| Name | Start Date |
|---|---|
| HSBC Global Asset Management (Hong Kong) Limited | 07-27-2022 |
| Fund Manager | RBC Indigo Asset Management Inc. |
|---|---|
| Advisor | HSBC Global Asset Management (Hong Kong) Limited |
| Custodian | CIBC Mellon Trust Company |
| Registrar | International Financial Data Services (Canada) Ltd |
| Distributor | HSBC Investment Funds (Canada) Inc. |
| Auditor | KPMG LLP, Chartered Accountants |
| RSP Eligible | Yes |
|---|---|
| PAC Allowed | Yes |
| PAC Initial Investment | 500 |
| PAC Subsequent | 50 |
| SWP Allowed | Yes |
| SWP Min Balance | 10,000 |
| SWP Min Withdrawal | 50 |
| MER | 2.64% |
|---|---|
| Management Fee | 2.25% |
| Load | No Load |
| FE Max | - |
| DSC Max | - |
| Trailer Fee Max (FE) | - |
| Trailer Fee Max (DSC) | - |
| Trailer Fee Max (NL) | 1.00% |
| Trailer Fee Max (LL) | - |
Join Fund Library now and get free access to personalized features to help you manage your investments.
 Fund Library