Join Fund Library now and get free access to personalized features to help you manage your investments.
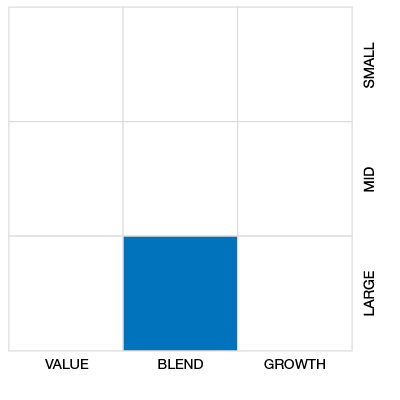
Canadian Focused Equity
 Click for more information on Fundata’s FundGrade
Click for more information on Fundata’s FundGrade.
 Click for more information on Fundata’s ESG Grade
Click for more information on Fundata’s ESG Grade.
|
NAVPS (05-01-2024) |
$16.70 |
|---|---|
| Change |
$0.02
(0.13%)
|
As at March 31, 2024
As at December 31, 2023
As at February 29, 2024
Inception Return (May 13, 2014): 7.36%
| Row Heading | Return | Annualized Return | ||||||||||||
|---|---|---|---|---|---|---|---|---|---|---|---|---|---|---|
| 1 Mth | 3 Mth | 6 Mth | YTD | 1 Yr | 2 Yr | 3 Yr | 4 Yr | 5 Yr | 6 Yr | 7 Yr | 8 Yr | 9 Yr | 10 Yr | |
| Fund | 2.90% | 6.97% | 11.79% | 6.97% | 13.24% | 5.48% | 9.28% | 15.33% | 8.71% | 7.99% | 8.32% | 9.26% | 6.27% | - |
| Benchmark | 3.64% | 7.74% | 16.61% | 7.74% | 16.32% | 5.70% | 8.49% | 15.92% | 9.66% | 9.13% | 8.45% | 9.56% | 7.77% | 8.09% |
| Category Average | 2.64% | 15.90% | 15.90% | 7.94% | 16.06% | 6.31% | 8.21% | 15.66% | 9.39% | 8.40% | 7.55% | 8.35% | 6.66% | 6.83% |
| Category Rank | 281 / 620 | 396 / 620 | 506 / 620 | 396 / 620 | 429 / 617 | 435 / 605 | 270 / 592 | 353 / 578 | 411 / 571 | 390 / 528 | 267 / 484 | 221 / 451 | 315 / 418 | - |
| Quartile Ranking | 2 | 3 | 4 | 3 | 3 | 3 | 2 | 3 | 3 | 3 | 3 | 2 | 4 | - |
| Return % | Apr | May | Jun | Jul | Aug | Sep | Oct | Nov | Dec | Jan | Feb | Mar |
|---|---|---|---|---|---|---|---|---|---|---|---|---|
| Fund | 2.92% | -4.94% | 3.84% | 2.56% | -0.10% | -2.68% | -0.62% | 3.46% | 1.64% | 1.43% | 2.49% | 2.90% |
| Benchmark | 2.42% | -3.65% | 3.16% | 2.78% | -1.03% | -3.68% | -2.36% | 7.23% | 3.38% | 0.82% | 3.10% | 3.64% |
10.09% (November 2020)
-16.59% (March 2020)
| Return % | 2014 | 2015 | 2016 | 2017 | 2018 | 2019 | 2020 | 2021 | 2022 | 2023 |
|---|---|---|---|---|---|---|---|---|---|---|
| Fund | - | -6.93% | 11.37% | 13.28% | -3.65% | 18.34% | -3.04% | 22.47% | -0.08% | 8.72% |
| Benchmark | 10.96% | -0.77% | 14.44% | 10.80% | -7.14% | 21.45% | 7.58% | 21.76% | -8.87% | 13.60% |
| Category Average | 9.08% | -2.47% | 11.42% | 8.06% | -8.78% | 18.54% | 7.73% | 22.26% | -9.42% | 13.34% |
| Quartile Ranking | - | 4 | 4 | 1 | 1 | 3 | 4 | 3 | 1 | 4 |
| Category Rank | - | 373/ 416 | 339/ 449 | 109/ 475 | 106/ 528 | 393/ 564 | 536/ 578 | 343/ 586 | 53/ 600 | 516/ 612 |
22.47% (2021)
-6.93% (2015)
| Name | Percent |
|---|---|
| Canadian Equity | 59.35 |
| International Equity | 20.95 |
| US Equity | 16.45 |
| Cash and Equivalents | 3.25 |
| Name | Percent |
|---|---|
| Financial Services | 33.12 |
| Energy | 19.71 |
| Consumer Services | 15.96 |
| Healthcare | 9.41 |
| Basic Materials | 7.66 |
| Other | 14.14 |
| Name | Percent |
|---|---|
| North America | 79.05 |
| Europe | 20.95 |
| Name | Percent |
|---|---|
| Fairfax Financial Holdings Ltd | 6.15 |
| Berkshire Hathaway Inc Cl B | 5.48 |
| Shell PLC - ADR | 5.01 |
| Royal Bank of Canada | 4.69 |
| Alimentation Couche-Tard Inc | 4.49 |
| ING Groep NV - ADR | 4.31 |
| Suncor Energy Inc | 4.27 |
| Koninklijke Ahold Delhaize NV | 4.17 |
| GlaxoSmithKline PLC - ADR | 4.07 |
| Brookfield Corp Cl A | 4.02 |

Sionna Opportunities Fund - Series A
Median
Other - Canadian Focused Equity
| Standard Deviation | 11.34% | 14.06% | - |
|---|---|---|---|
| Beta | 0.77% | 0.89% | - |
| Alpha | 0.03% | 0.00% | - |
| Rsquared | 0.76% | 0.83% | - |
| Sharpe | 0.61% | 0.53% | - |
| Sortino | 0.85% | 0.62% | - |
| Treynor | 0.09% | 0.08% | - |
| Tax Efficiency | 79.18% | 86.13% | - |
| Volatility |

|
|
- |

| Key Ratio | 1 Yr | 3 Yr | 5 Yr | 10 Yr |
|---|---|---|---|---|
| Standard Deviation | 9.30% | 11.34% | 14.06% | - |
| Beta | 0.72% | 0.77% | 0.89% | - |
| Alpha | 0.02% | 0.03% | 0.00% | - |
| Rsquared | 0.81% | 0.76% | 0.83% | - |
| Sharpe | 0.88% | 0.61% | 0.53% | - |
| Sortino | 1.64% | 0.85% | 0.62% | - |
| Treynor | 0.11% | 0.09% | 0.08% | - |
| Tax Efficiency | 91.63% | 79.18% | 86.13% | - |
The E, S, and G scores are averaged for each security in the portfolio, to arrive at an ESG score for each security. We take the portfolio weighted average of the ESG scores for each fund and rank them against their peers to arrive at the Fundata ESG Score from 0-100.
Three scores under the Environment bucket are averaged to yield the Fundata Environment Score for each fund from 0-100: (1) Pollution Prevention, (2) Environmental Transparency, (3) Resource Efficiency.
Six scores under the Social bucket are averaged to yield the Fundata Social Score for each fund from 0-100. (1) Compensation and Satisfaction, (2) Diversity and Rights, (3) Education and Work Conditions, (4) Community and Charity, (5) Human Rights, (6) Sustainability Integration.
Three scores under the governance bucket are averaged to yield the Fundata Governance Score for each fund from 0-100: (1) Board Effectiveness, (2) Management Ethics, (3) Disclosure and Accountability.
Powered by OWL Analytics. For more information, please contact Fundata Canada.
| Start Date | May 13, 2014 |
|---|---|
| Instrument Type | Mutual Fund |
| Share Class | Commission Based Advice |
| Legal Status | Trust |
| Sales Status | Open |
| Currency | CAD |
| Distribution Frequency | Annual |
| Assets ($mil) | $76 |
| FundServ Code | Load Code | Sales Status |
|---|---|---|
| BIP165 | ||
| BIP235 | ||
| BIP275 |
The fundamental investment objective of Sionna Opportunities Fund is to achieve long-term capital appreciation by investing primarily in the equity securities of Canadian issuers. The Fund may also invest in foreign equity securities.
Sionna applies a relative Graham & Dodd value approach to stock selection. Generally, stocks of Canadian and foreign companies that are financially strong and have a measurable worth will be bought when, in Sionna’s view, the stock is selling at a price below its estimated worth or its intrinsic value. Sionna believes that the market will eventually recognize the value of such a company and its stock price will rise towards its intrinsic value.
| Name | Start Date |
|---|---|
| Kim Shannon | 03-13-2020 |
| Mel Mariampillai | 03-13-2020 |
| Marian Hoffmann | 03-13-2020 |
| Dave Britton | 03-13-2020 |
| Teresa Lee | 03-13-2020 |
| Bridgehouse Asset Managers | 12-06-2020 |
| Fund Manager | Bridgehouse Asset Managers |
|---|---|
| Advisor | Bridgehouse Asset Managers |
| Custodian | State Street Trust Company Canada |
| Registrar | International Financial Data Services (Canada) Ltd |
| Distributor | - |
| Auditor | PriceWaterhouseCoopers LLP |
| RSP Eligible | Yes |
|---|---|
| PAC Allowed | Yes |
| PAC Initial Investment | 1,000 |
| PAC Subsequent | 100 |
| SWP Allowed | Yes |
| SWP Min Balance | 10,000 |
| SWP Min Withdrawal | 100 |
| MER | 2.39% |
|---|---|
| Management Fee | 1.90% |
| Load | Choice of Front or No Load |
| FE Max | 5.00% |
| DSC Max | 5.50% |
| Trailer Fee Max (FE) | 1.00% |
| Trailer Fee Max (DSC) | 1.00% |
| Trailer Fee Max (NL) | - |
| Trailer Fee Max (LL) | - |
Join Fund Library now and get free access to personalized features to help you manage your investments.
 Fund Library