Join Fund Library now and get free access to personalized features to help you manage your investments.
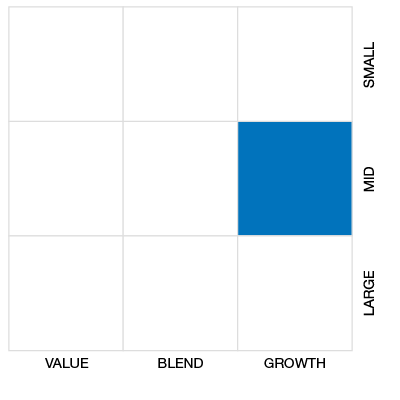
Cdn Small/Mid Cap Equity
 Click for more information on Fundata’s FundGrade
Click for more information on Fundata’s FundGrade.
 Click for more information on Fundata’s ESG Grade
Click for more information on Fundata’s ESG Grade.

2023, 2022, 2021, 2020
Click for more information on Fundata’s FundGrade
|
NAVPS (05-01-2024) |
$24.45 |
|---|---|
| Change |
$0.04
(0.17%)
|
As at March 31, 2024
As at February 29, 2024
As at February 29, 2024
Inception Return (June 15, 2012): 11.26%
| Row Heading | Return | Annualized Return | ||||||||||||
|---|---|---|---|---|---|---|---|---|---|---|---|---|---|---|
| 1 Mth | 3 Mth | 6 Mth | YTD | 1 Yr | 2 Yr | 3 Yr | 4 Yr | 5 Yr | 6 Yr | 7 Yr | 8 Yr | 9 Yr | 10 Yr | |
| Fund | 0.87% | 3.53% | 8.92% | 3.53% | -0.39% | 0.06% | 3.06% | 15.04% | 11.52% | 8.46% | 9.60% | 10.38% | 7.31% | 6.99% |
| Benchmark | 7.49% | 7.92% | 14.37% | 7.92% | 8.22% | -2.72% | 3.99% | 22.48% | 7.82% | 6.15% | 4.23% | 7.10% | 5.60% | 3.95% |
| Category Average | 2.61% | 14.11% | 14.11% | 6.51% | 10.12% | 0.74% | 4.35% | 17.73% | 7.77% | 6.09% | 4.99% | 6.38% | 4.84% | 4.30% |
| Category Rank | 210 / 219 | 213 / 216 | 211 / 215 | 213 / 216 | 209 / 215 | 138 / 213 | 128 / 203 | 160 / 195 | 39 / 187 | 61 / 179 | 10 / 169 | 10 / 167 | 39 / 143 | 29 / 138 |
| Quartile Ranking | 4 | 4 | 4 | 4 | 4 | 3 | 3 | 4 | 1 | 2 | 1 | 1 | 2 | 1 |
| Return % | Apr | May | Jun | Jul | Aug | Sep | Oct | Nov | Dec | Jan | Feb | Mar |
|---|---|---|---|---|---|---|---|---|---|---|---|---|
| Fund | -1.23% | -1.16% | 3.54% | -1.53% | -3.91% | -4.37% | -6.27% | 6.49% | 5.39% | 0.83% | 1.79% | 0.87% |
| Benchmark | -1.16% | -4.06% | 0.59% | 6.09% | -1.31% | -5.24% | -2.58% | 4.84% | 3.76% | -0.37% | 0.77% | 7.49% |
19.22% (November 2020)
-17.46% (March 2020)
| Return % | 2014 | 2015 | 2016 | 2017 | 2018 | 2019 | 2020 | 2021 | 2022 | 2023 |
|---|---|---|---|---|---|---|---|---|---|---|
| Fund | 19.35% | -12.15% | 3.09% | 29.93% | -17.76% | 37.47% | 20.49% | 19.76% | -7.25% | 2.20% |
| Benchmark | -2.34% | -13.31% | 38.48% | 2.75% | -18.17% | 15.84% | 12.87% | 20.27% | -9.29% | 4.79% |
| Category Average | 3.45% | -6.13% | 18.01% | 3.43% | -15.15% | 16.59% | 11.91% | 22.35% | -11.32% | 6.49% |
| Quartile Ranking | 1 | 4 | 4 | 1 | 3 | 1 | 1 | 4 | 2 | 3 |
| Category Rank | 7/ 137 | 133/ 142 | 163/ 164 | 4/ 169 | 133/ 179 | 3/ 186 | 34/ 191 | 154/ 203 | 64/ 212 | 156/ 215 |
37.47% (2019)
-17.76% (2018)
| Name | Percent |
|---|---|
| Canadian Equity | 91.45 |
| Cash and Equivalents | 6.21 |
| US Equity | 2.34 |
| Name | Percent |
|---|---|
| Industrial Services | 22.73 |
| Consumer Services | 16.87 |
| Technology | 12.09 |
| Consumer Goods | 11.71 |
| Industrial Goods | 11.25 |
| Other | 25.35 |
| Name | Percent |
|---|---|
| North America | 100.00 |
| Name | Percent |
|---|---|
| TFI International Inc | 8.64 |
| Leon's Furniture Ltd | 7.07 |
| Calian Group Ltd | 6.26 |
| Cash & Equivalents | 6.21 |
| ATS Corp | 5.94 |
| Bombardier Inc Cl B | 5.70 |
| Heroux Devtek Inc | 5.55 |
| CAE Inc | 4.54 |
| Open Text Corp | 4.41 |
| Aritzia Inc | 4.29 |

North Growth Canadian Equity Fund Series N
Median
Other - Cdn Small/Mid Cap Equity
| Standard Deviation | 16.16% | 19.29% | 16.86% |
|---|---|---|---|
| Beta | 0.69% | 0.62% | 0.59% |
| Alpha | 0.01% | 0.06% | 0.05% |
| Rsquared | 0.50% | 0.64% | 0.50% |
| Sharpe | 0.10% | 0.56% | 0.40% |
| Sortino | 0.12% | 0.81% | 0.47% |
| Treynor | 0.02% | 0.18% | 0.12% |
| Tax Efficiency | 41.55% | 84.08% | 77.78% |
| Volatility |

|

|
|

| Key Ratio | 1 Yr | 3 Yr | 5 Yr | 10 Yr |
|---|---|---|---|---|
| Standard Deviation | 13.51% | 16.16% | 19.29% | 16.86% |
| Beta | 0.57% | 0.69% | 0.62% | 0.59% |
| Alpha | -0.05% | 0.01% | 0.06% | 0.05% |
| Rsquared | 0.35% | 0.50% | 0.64% | 0.50% |
| Sharpe | -0.32% | 0.10% | 0.56% | 0.40% |
| Sortino | -0.27% | 0.12% | 0.81% | 0.47% |
| Treynor | -0.08% | 0.02% | 0.18% | 0.12% |
| Tax Efficiency | - | 41.55% | 84.08% | 77.78% |
The E, S, and G scores are averaged for each security in the portfolio, to arrive at an ESG score for each security. We take the portfolio weighted average of the ESG scores for each fund and rank them against their peers to arrive at the Fundata ESG Score from 0-100.
Three scores under the Environment bucket are averaged to yield the Fundata Environment Score for each fund from 0-100: (1) Pollution Prevention, (2) Environmental Transparency, (3) Resource Efficiency.
Six scores under the Social bucket are averaged to yield the Fundata Social Score for each fund from 0-100. (1) Compensation and Satisfaction, (2) Diversity and Rights, (3) Education and Work Conditions, (4) Community and Charity, (5) Human Rights, (6) Sustainability Integration.
Three scores under the governance bucket are averaged to yield the Fundata Governance Score for each fund from 0-100: (1) Board Effectiveness, (2) Management Ethics, (3) Disclosure and Accountability.
Powered by OWL Analytics. For more information, please contact Fundata Canada.
| Start Date | June 15, 2012 |
|---|---|
| Instrument Type | Mutual Fund |
| Share Class | Do-It-Yourself |
| Legal Status | Trust |
| Sales Status | Open |
| Currency | CAD |
| Distribution Frequency | Annual |
| Assets ($mil) | $39 |
| FundServ Code | Load Code | Sales Status |
|---|---|---|
| NGM271 |
The objective of the Fund is to achieve long-term growth through capital appreciation by investing in equity securities of Canadian high potential growth companies.
The Fund will pursue its objective by investing primarily in equity securities of Canadian corporations.
| Name | Start Date |
|---|---|
| Alex Joshi | 01-08-2021 |
| Jorge Marques | 01-08-2021 |
| Erica Lau | 01-08-2021 |
| Fund Manager | North Growth Management Ltd. |
|---|---|
| Advisor | North Growth Management Ltd. |
| Custodian | RBC Investor Services Trust (Canada) |
| Registrar | North Growth Management Ltd. |
| Distributor | - |
| Auditor | Deloitte & Touche LLP, Chartered Accountants |
| RSP Eligible | Yes |
|---|---|
| PAC Allowed | No |
| PAC Initial Investment | - |
| PAC Subsequent | - |
| SWP Allowed | No |
| SWP Min Balance | - |
| SWP Min Withdrawal | - |
| MER | 1.00% |
|---|---|
| Management Fee | 1.25% |
| Load | No Load |
| FE Max | - |
| DSC Max | - |
| Trailer Fee Max (FE) | - |
| Trailer Fee Max (DSC) | - |
| Trailer Fee Max (NL) | - |
| Trailer Fee Max (LL) | - |
Join Fund Library now and get free access to personalized features to help you manage your investments.
 Fund Library