Join Fund Library now and get free access to personalized features to help you manage your investments.
Canadian Focused Equity
 Click for more information on Fundata’s FundGrade
Click for more information on Fundata’s FundGrade.
 Click for more information on Fundata’s ESG Grade
Click for more information on Fundata’s ESG Grade.
|
NAVPS (05-01-2024) |
$13.02 |
|---|---|
| Change |
$0.00
(-0.03%)
|
As at March 31, 2024
As at March 31, 2024
As at February 29, 2024
Inception Return (March 06, 2014): 7.00%
| Row Heading | Return | Annualized Return | ||||||||||||
|---|---|---|---|---|---|---|---|---|---|---|---|---|---|---|
| 1 Mth | 3 Mth | 6 Mth | YTD | 1 Yr | 2 Yr | 3 Yr | 4 Yr | 5 Yr | 6 Yr | 7 Yr | 8 Yr | 9 Yr | 10 Yr | |
| Fund | 3.55% | 6.72% | 8.73% | 6.72% | 10.18% | -2.20% | 1.31% | 12.15% | 8.33% | 7.17% | 6.91% | 7.08% | 6.15% | 7.04% |
| Benchmark | 3.64% | 7.74% | 16.61% | 7.74% | 16.32% | 5.70% | 8.49% | 15.92% | 9.66% | 9.13% | 8.45% | 9.56% | 7.77% | 8.09% |
| Category Average | 2.64% | 15.90% | 15.90% | 7.94% | 16.06% | 6.31% | 8.21% | 15.66% | 9.39% | 8.40% | 7.55% | 8.35% | 6.66% | 6.83% |
| Category Rank | 135 / 620 | 418 / 620 | 589 / 620 | 418 / 620 | 538 / 617 | 603 / 605 | 590 / 592 | 551 / 578 | 437 / 571 | 434 / 528 | 371 / 484 | 395 / 451 | 325 / 418 | 267 / 400 |
| Quartile Ranking | 1 | 3 | 4 | 3 | 4 | 4 | 4 | 4 | 4 | 4 | 4 | 4 | 4 | 3 |
| Return % | Apr | May | Jun | Jul | Aug | Sep | Oct | Nov | Dec | Jan | Feb | Mar |
|---|---|---|---|---|---|---|---|---|---|---|---|---|
| Fund | 0.21% | -1.12% | 0.33% | 2.87% | 0.31% | -1.22% | -1.59% | 2.52% | 0.98% | 2.68% | 0.37% | 3.55% |
| Benchmark | 2.42% | -3.65% | 3.16% | 2.78% | -1.03% | -3.68% | -2.36% | 7.23% | 3.38% | 0.82% | 3.10% | 3.64% |
11.05% (April 2020)
-11.65% (March 2020)
| Return % | 2014 | 2015 | 2016 | 2017 | 2018 | 2019 | 2020 | 2021 | 2022 | 2023 |
|---|---|---|---|---|---|---|---|---|---|---|
| Fund | - | 6.94% | 2.55% | 9.20% | -7.04% | 17.76% | 14.73% | 20.48% | -7.89% | 1.82% |
| Benchmark | 10.96% | -0.77% | 14.44% | 10.80% | -7.14% | 21.45% | 7.58% | 21.76% | -8.87% | 13.60% |
| Category Average | 9.08% | -2.47% | 11.42% | 8.06% | -8.78% | 18.54% | 7.73% | 22.26% | -9.42% | 13.34% |
| Quartile Ranking | - | 1 | 4 | 2 | 2 | 3 | 1 | 4 | 2 | 4 |
| Category Rank | - | 48/ 416 | 441/ 449 | 196/ 475 | 259/ 528 | 407/ 564 | 108/ 578 | 485/ 586 | 213/ 600 | 611/ 612 |
20.48% (2021)
-7.89% (2022)
| Name | Percent |
|---|---|
| Canadian Equity | 49.15 |
| Cash and Equivalents | 35.90 |
| Income Trust Units | 9.03 |
| US Equity | 4.82 |
| International Equity | 0.58 |
| Other | 0.52 |
| Name | Percent |
|---|---|
| Cash and Cash Equivalent | 35.90 |
| Basic Materials | 14.69 |
| Energy | 10.30 |
| Real Estate | 8.33 |
| Consumer Services | 5.08 |
| Other | 25.70 |
| Name | Percent |
|---|---|
| North America | 98.61 |
| Latin America | 0.81 |
| Africa and Middle East | 0.48 |
| Europe | 0.09 |
| Other | 0.01 |
| Name | Percent |
|---|---|
| Canada Government 0.00% 06-Jun-2024 | 23.21 |
| Cash and Cash Equivalents | 12.48 |
| Sprott Physical Uranium Trust - Units | 4.76 |
| Secure Energy Services Inc | 3.28 |
| AG Growth International Inc | 2.74 |
| K-Bro Linen Inc | 2.63 |
| Pollard Banknote Ltd | 2.41 |
| North American Construction Group Ltd | 2.32 |
| Information Services Corp Cl A | 2.06 |
| Headwater Exploration Inc | 2.02 |

Exemplar Performance Fund Series A
Median
Other - Canadian Focused Equity
| Standard Deviation | 8.03% | 11.69% | 9.35% |
|---|---|---|---|
| Beta | 0.41% | 0.60% | 0.60% |
| Alpha | -0.02% | 0.03% | 0.02% |
| Rsquared | 0.42% | 0.55% | 0.57% |
| Sharpe | -0.12% | 0.58% | 0.63% |
| Sortino | -0.23% | 0.75% | 0.69% |
| Treynor | -0.02% | 0.11% | 0.10% |
| Tax Efficiency | - | 72.39% | - |
| Volatility |

|

|

|

| Key Ratio | 1 Yr | 3 Yr | 5 Yr | 10 Yr |
|---|---|---|---|---|
| Standard Deviation | 5.98% | 8.03% | 11.69% | 9.35% |
| Beta | 0.38% | 0.41% | 0.60% | 0.60% |
| Alpha | 0.04% | -0.02% | 0.03% | 0.02% |
| Rsquared | 0.53% | 0.42% | 0.55% | 0.57% |
| Sharpe | 0.86% | -0.12% | 0.58% | 0.63% |
| Sortino | 2.53% | -0.23% | 0.75% | 0.69% |
| Treynor | 0.14% | -0.02% | 0.11% | 0.10% |
| Tax Efficiency | 100.00% | - | 72.39% | - |
The E, S, and G scores are averaged for each security in the portfolio, to arrive at an ESG score for each security. We take the portfolio weighted average of the ESG scores for each fund and rank them against their peers to arrive at the Fundata ESG Score from 0-100.
Three scores under the Environment bucket are averaged to yield the Fundata Environment Score for each fund from 0-100: (1) Pollution Prevention, (2) Environmental Transparency, (3) Resource Efficiency.
Six scores under the Social bucket are averaged to yield the Fundata Social Score for each fund from 0-100. (1) Compensation and Satisfaction, (2) Diversity and Rights, (3) Education and Work Conditions, (4) Community and Charity, (5) Human Rights, (6) Sustainability Integration.
Three scores under the governance bucket are averaged to yield the Fundata Governance Score for each fund from 0-100: (1) Board Effectiveness, (2) Management Ethics, (3) Disclosure and Accountability.
Powered by OWL Analytics. For more information, please contact Fundata Canada.
| Start Date | March 06, 2014 |
|---|---|
| Instrument Type | Mutual Fund |
| Share Class | Commission Based Advice |
| Legal Status | Trust |
| Sales Status | Open |
| Currency | CAD |
| Distribution Frequency | Annual |
| Assets ($mil) | $9 |
| FundServ Code | Load Code | Sales Status |
|---|---|---|
| AHP1200 |
The investment objective of the Exemplar Performance Fund is to achieve capital appreciation over both short and long term horizons primarily through the selection and management of shares of Canadian equity securities. Unitholder approval (given by a majority of votes cast at a meeting of unitholders) is required prior to a change of investment objectives.
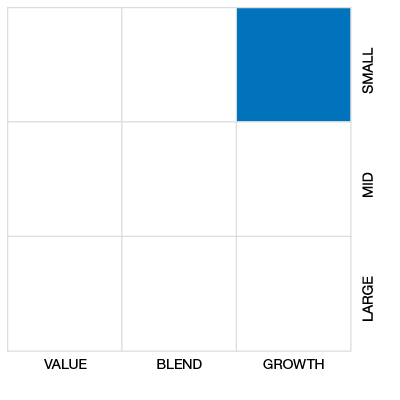
To achieve the investment objectives, the Fund will invest predominantly in large and mid-capitalization Canadian companies. The Fund may invest outside of this investment focus to an extent that will vary from time to time but is not typically expected to exceed 49% of its assets at the time of purchase. The Fund may also invest in bonds and other debt instruments if warranted by financial conditions.
| Name | Start Date |
|---|---|
| Chung Kim | 02-28-2023 |
| Fund Manager | Arrow Capital Management Inc. |
|---|---|
| Advisor | Arrow Capital Management Inc. |
| Custodian | CIBC Mellon Trust Company |
| Registrar | RBC Investor Services Trust (Canada) |
| Distributor | - |
| Auditor | PriceWaterhouseCoopers LLP |
| RSP Eligible | Yes |
|---|---|
| PAC Allowed | Yes |
| PAC Initial Investment | 1,000 |
| PAC Subsequent | 100 |
| SWP Allowed | Yes |
| SWP Min Balance | 1,000 |
| SWP Min Withdrawal | 100 |
| MER | 2.86% |
|---|---|
| Management Fee | 2.00% |
| Load | Back Fee Only |
| FE Max | 5.00% |
| DSC Max | - |
| Trailer Fee Max (FE) | 1.00% |
| Trailer Fee Max (DSC) | - |
| Trailer Fee Max (NL) | - |
| Trailer Fee Max (LL) | - |
Join Fund Library now and get free access to personalized features to help you manage your investments.
 Fund Library