Join Fund Library now and get free access to personalized features to help you manage your investments.
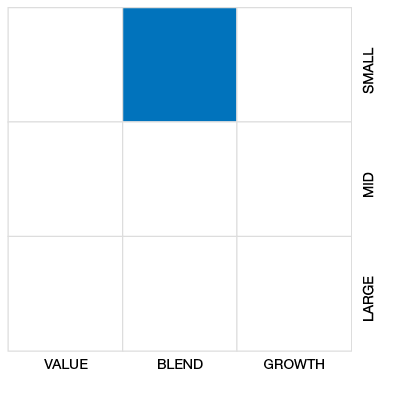
Cdn Foc Small/Mid Cap Eq
 Click for more information on Fundata’s FundGrade
Click for more information on Fundata’s FundGrade.
|
NAVPS (04-30-2024) |
$35.32 |
|---|---|
| Change |
-$0.10
(-0.29%)
|
As at March 31, 2024
As at June 30, 2023
Inception Return (September 01, 1986): 8.22%
| Row Heading | Return | Annualized Return | ||||||||||||
|---|---|---|---|---|---|---|---|---|---|---|---|---|---|---|
| 1 Mth | 3 Mth | 6 Mth | YTD | 1 Yr | 2 Yr | 3 Yr | 4 Yr | 5 Yr | 6 Yr | 7 Yr | 8 Yr | 9 Yr | 10 Yr | |
| Fund | 1.42% | 2.18% | -1.99% | 2.18% | -4.93% | 1.15% | 2.89% | 25.84% | 4.79% | 4.39% | 5.66% | 7.10% | 2.99% | 2.84% |
| Benchmark | 6.22% | 7.87% | 15.65% | 7.87% | 11.58% | 0.96% | 4.53% | 20.26% | 8.17% | 6.65% | 5.62% | 8.00% | 6.54% | 5.76% |
| Category Average | 3.35% | 16.52% | 16.52% | 8.19% | 12.63% | 2.82% | 2.99% | 17.63% | 9.94% | 8.76% | 8.17% | 9.31% | 7.63% | 7.33% |
| Category Rank | 49 / 52 | 49 / 52 | 52 / 52 | 49 / 52 | 52 / 52 | 39 / 52 | 38 / 52 | 3 / 52 | 45 / 49 | 36 / 40 | 20 / 33 | 21 / 32 | 31 / 31 | 25 / 25 |
| Quartile Ranking | 4 | 4 | 4 | 4 | 4 | 3 | 3 | 1 | 4 | 4 | 3 | 3 | 4 | 4 |
| Return % | Apr | May | Jun | Jul | Aug | Sep | Oct | Nov | Dec | Jan | Feb | Mar |
|---|---|---|---|---|---|---|---|---|---|---|---|---|
| Fund | -2.35% | 1.44% | 1.32% | 1.03% | -0.08% | -4.25% | -4.22% | 1.14% | -0.99% | -0.75% | 1.51% | 1.42% |
| Benchmark | -0.62% | -3.64% | 1.79% | 5.38% | -1.04% | -5.08% | -2.79% | 5.65% | 4.40% | -0.78% | 2.34% | 6.22% |
17.59% (November 2020)
-23.18% (March 2020)
| Return % | 2014 | 2015 | 2016 | 2017 | 2018 | 2019 | 2020 | 2021 | 2022 | 2023 |
|---|---|---|---|---|---|---|---|---|---|---|
| Fund | 14.20% | -12.83% | -3.57% | 22.09% | -7.15% | -17.67% | 13.52% | 55.98% | -8.73% | -1.58% |
| Benchmark | 1.95% | -3.54% | 27.23% | 7.15% | -14.41% | 17.42% | 12.92% | 18.74% | -10.51% | 8.17% |
| Category Average | 6.09% | -2.19% | 16.27% | 9.79% | -11.20% | 21.83% | 30.06% | 13.94% | -13.64% | 7.90% |
| Quartile Ranking | 2 | 4 | 4 | 1 | 1 | 4 | 2 | 1 | 1 | 4 |
| Category Rank | 7/ 25 | 28/ 29 | 32/ 32 | 4/ 33 | 2/ 40 | 43/ 43 | 15/ 52 | 2/ 52 | 13/ 52 | 52/ 52 |
55.98% (2021)
-17.67% (2019)
| Name | Percent |
|---|---|
| Canadian Equity | 53.54 |
| Foreign Corporate Bonds | 33.62 |
| US Equity | 7.72 |
| Canadian Corporate Bonds | 5.24 |
| Cash and Equivalents | -0.12 |
| Name | Percent |
|---|---|
| Fixed Income | 38.86 |
| Consumer Services | 14.49 |
| Energy | 11.84 |
| Financial Services | 10.98 |
| Consumer Goods | 6.24 |
| Other | 17.59 |
| Name | Percent |
|---|---|
| North America | 100.12 |
| Other | -0.12 |
| Name | Percent |
|---|---|
| USD SWEEP VII CIBC MELLON 1.50% 31-Dec-2049 | 33.62 |
| TWC Enterprises Ltd | 9.46 |
| EXCO Resources Inc | 7.72 |
| Home Capital Group Inc | 7.23 |
| BlackBerry Ltd | 5.93 |
| Bausch Health Cos Inc | 5.47 |
| Reitmans Canada Ltd | 4.89 |
| Hertz Global Holdings Inc 13.80% 30-Jun-2051 | 4.86 |
| Linamar Corp | 4.31 |
| Parex Resources Inc | 4.11 |

Chou RRSP Fund Series A
Median
Other - Cdn Foc Small/Mid Cap Eq
| Standard Deviation | 14.42% | 23.97% | 19.40% |
|---|---|---|---|
| Beta | 0.48% | 0.85% | 0.79% |
| Alpha | 0.01% | -0.01% | -0.01% |
| Rsquared | 0.26% | 0.58% | 0.49% |
| Sharpe | 0.09% | 0.23% | 0.17% |
| Sortino | 0.10% | 0.29% | 0.13% |
| Treynor | 0.03% | 0.07% | 0.04% |
| Tax Efficiency | 91.64% | 85.67% | 73.38% |
| Volatility |

|

|
|

| Key Ratio | 1 Yr | 3 Yr | 5 Yr | 10 Yr |
|---|---|---|---|---|
| Standard Deviation | 7.49% | 14.42% | 23.97% | 19.40% |
| Beta | 0.35% | 0.48% | 0.85% | 0.79% |
| Alpha | -0.09% | 0.01% | -0.01% | -0.01% |
| Rsquared | 0.39% | 0.26% | 0.58% | 0.49% |
| Sharpe | -1.27% | 0.09% | 0.23% | 0.17% |
| Sortino | -1.11% | 0.10% | 0.29% | 0.13% |
| Treynor | -0.27% | 0.03% | 0.07% | 0.04% |
| Tax Efficiency | - | 91.64% | 85.67% | 73.38% |
| Start Date | September 01, 1986 |
|---|---|
| Instrument Type | Mutual Fund |
| Share Class | Commission Based Advice |
| Legal Status | Trust |
| Sales Status | Open |
| Currency | CAD |
| Distribution Frequency | Annual |
| Assets ($mil) | $34 |
| FundServ Code | Load Code | Sales Status |
|---|---|---|
| CHO102 |
The Fund's objective is to provide long-term growth of capital by investing in equity and debt instruments of primarily Canadian businesses. The Fund may invest in equity and debt instruments of U.S. and foreign businesses. Investments may include common and preferred shares, convertible debentures, warrants, government and corporate bonds and short-term indebtedness.
The investment process followed in selecting equity investments, convertible debentures, warrants, government and corporate bonds and short-term indebtedness for the Funds is a value-oriented approach to investing. This involves a detailed analysis of the strengths of individual companies, with much less emphasis on short-term market factors.
| Name | Start Date |
|---|---|
| Francis Chou | 10-10-1986 |
| Fund Manager | Chou Associates Management Inc. |
|---|---|
| Advisor | Chou Associates Management Inc. |
| Custodian | CIBC Mellon Trust Company |
| Registrar | CIBC Mellon Global Securities Services Company |
| Distributor | - |
| Auditor | Grant Thornton LLP |
| RSP Eligible | Yes |
|---|---|
| PAC Allowed | No |
| PAC Initial Investment | - |
| PAC Subsequent | - |
| SWP Allowed | No |
| SWP Min Balance | - |
| SWP Min Withdrawal | - |
| MER | 1.81% |
|---|---|
| Management Fee | 1.50% |
| Load | Back Fee Only |
| FE Max | 2.00% |
| DSC Max | - |
| Trailer Fee Max (FE) | 0.50% |
| Trailer Fee Max (DSC) | - |
| Trailer Fee Max (NL) | - |
| Trailer Fee Max (LL) | - |
Join Fund Library now and get free access to personalized features to help you manage your investments.
 Fund Library