Join Fund Library now and get free access to personalized features to help you manage your investments.
Emerging Markets Equity
 Click for more information on Fundata’s FundGrade
Click for more information on Fundata’s FundGrade.
 Click for more information on Fundata’s ESG Grade
Click for more information on Fundata’s ESG Grade.
|
NAVPS (04-30-2024) |
$21.62 |
|---|---|
| Change |
-$0.13
(-0.60%)
|
As at March 31, 2024
As at November 30, 2023
As at February 29, 2024
Inception Return (January 12, 2001): 4.31%
| Row Heading | Return | Annualized Return | ||||||||||||
|---|---|---|---|---|---|---|---|---|---|---|---|---|---|---|
| 1 Mth | 3 Mth | 6 Mth | YTD | 1 Yr | 2 Yr | 3 Yr | 4 Yr | 5 Yr | 6 Yr | 7 Yr | 8 Yr | 9 Yr | 10 Yr | |
| Fund | 2.78% | 6.64% | 10.34% | 6.64% | 7.20% | 0.10% | -4.30% | 5.52% | 0.36% | -1.32% | 1.16% | 3.62% | 1.87% | 2.65% |
| Benchmark | 1.24% | 4.58% | 9.24% | 4.58% | 8.92% | 3.21% | -1.06% | 7.65% | 3.16% | 2.21% | 4.53% | 6.45% | 4.58% | 5.74% |
| Category Average | 2.10% | 10.05% | 10.05% | 4.70% | 8.36% | 1.86% | -3.88% | 7.39% | 2.46% | 0.91% | 3.36% | 5.18% | 3.24% | 3.66% |
| Category Rank | 76 / 334 | 45 / 331 | 163 / 328 | 45 / 331 | 205 / 314 | 240 / 302 | 179 / 278 | 205 / 268 | 209 / 251 | 177 / 205 | 169 / 194 | 132 / 160 | 122 / 147 | 117 / 135 |
| Quartile Ranking | 1 | 1 | 2 | 1 | 3 | 4 | 3 | 4 | 4 | 4 | 4 | 4 | 4 | 4 |
| Return % | Apr | May | Jun | Jul | Aug | Sep | Oct | Nov | Dec | Jan | Feb | Mar |
|---|---|---|---|---|---|---|---|---|---|---|---|---|
| Fund | -1.25% | -2.29% | 2.29% | 5.02% | -3.49% | -2.88% | -2.08% | 4.80% | 0.83% | -2.35% | 6.26% | 2.78% |
| Benchmark | -0.32% | -2.01% | 1.39% | 5.60% | -2.72% | -1.99% | -1.05% | 4.87% | 0.67% | -2.21% | 5.63% | 1.24% |
14.78% (March 2009)
-18.36% (September 2008)
| Return % | 2014 | 2015 | 2016 | 2017 | 2018 | 2019 | 2020 | 2021 | 2022 | 2023 |
|---|---|---|---|---|---|---|---|---|---|---|
| Fund | 4.69% | -1.11% | 7.92% | 25.02% | -13.76% | 14.13% | 9.52% | -1.51% | -19.20% | 4.88% |
| Benchmark | 8.76% | 2.69% | 7.90% | 26.42% | -6.05% | 15.55% | 11.45% | 0.08% | -12.38% | 7.03% |
| Category Average | 2.91% | -3.92% | 6.53% | 28.88% | -11.86% | 15.06% | 17.52% | -3.30% | -17.32% | 8.68% |
| Quartile Ranking | 3 | 4 | 2 | 4 | 4 | 3 | 4 | 2 | 4 | 4 |
| Category Rank | 86/ 133 | 126/ 146 | 57/ 157 | 150/ 188 | 170/ 204 | 134/ 248 | 216/ 263 | 107/ 271 | 225/ 291 | 241/ 312 |
25.02% (2017)
-19.20% (2022)
| Name | Percent |
|---|---|
| International Equity | 92.51 |
| Cash and Equivalents | 4.92 |
| US Equity | 1.75 |
| Income Trust Units | 0.47 |
| Canadian Equity | 0.33 |
| Other | 0.02 |
| Name | Percent |
|---|---|
| Technology | 28.97 |
| Financial Services | 22.13 |
| Consumer Goods | 10.32 |
| Basic Materials | 7.01 |
| Consumer Services | 6.96 |
| Other | 24.61 |
| Name | Percent |
|---|---|
| Asia | 70.21 |
| Latin America | 13.38 |
| North America | 5.49 |
| Europe | 5.49 |
| Africa and Middle East | 5.25 |
| Other | 0.18 |
| Name | Percent |
|---|---|
| Taiwan Semiconductor Manufactrg Co Ltd | 4.03 |
| Samsung Electronics Co Ltd | 3.79 |
| Tencent Holdings Ltd | 2.97 |
| RICL CAD CASH MGT FND SERIES O | 2.58 |
| Taiwan Semiconductor Manufactrg Co Ltd - ADR | 1.83 |
| Alibaba Group Holding Ltd | 1.51 |
| SK Hynix Inc | 1.23 |
| Bank Rakyat Indonesia (Persero) Tbk PT | 1.21 |
| Mercadolibre Inc | 1.12 |
| Hon Hai Precision Industry Co Ltd | 0.92 |
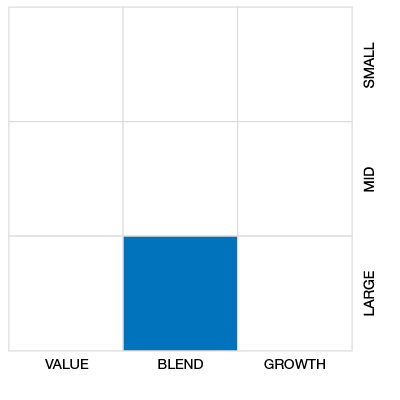

Russell Investments Emerging Markets Equity Pool Series B
Median
Other - Emerging Markets Equity
| Standard Deviation | 14.76% | 15.87% | 14.18% |
|---|---|---|---|
| Beta | 1.10% | 1.10% | 1.04% |
| Alpha | -0.03% | -0.03% | -0.03% |
| Rsquared | 0.95% | 0.96% | 0.95% |
| Sharpe | -0.40% | -0.02% | 0.16% |
| Sortino | -0.64% | -0.12% | 0.06% |
| Treynor | -0.05% | 0.00% | 0.02% |
| Tax Efficiency | - | - | 74.24% |
| Volatility |

|
|
|

| Key Ratio | 1 Yr | 3 Yr | 5 Yr | 10 Yr |
|---|---|---|---|---|
| Standard Deviation | 12.06% | 14.76% | 15.87% | 14.18% |
| Beta | 1.10% | 1.10% | 1.10% | 1.04% |
| Alpha | -0.02% | -0.03% | -0.03% | -0.03% |
| Rsquared | 0.95% | 0.95% | 0.96% | 0.95% |
| Sharpe | 0.24% | -0.40% | -0.02% | 0.16% |
| Sortino | 0.69% | -0.64% | -0.12% | 0.06% |
| Treynor | 0.03% | -0.05% | 0.00% | 0.02% |
| Tax Efficiency | 94.16% | - | - | 74.24% |
The E, S, and G scores are averaged for each security in the portfolio, to arrive at an ESG score for each security. We take the portfolio weighted average of the ESG scores for each fund and rank them against their peers to arrive at the Fundata ESG Score from 0-100.
Three scores under the Environment bucket are averaged to yield the Fundata Environment Score for each fund from 0-100: (1) Pollution Prevention, (2) Environmental Transparency, (3) Resource Efficiency.
Six scores under the Social bucket are averaged to yield the Fundata Social Score for each fund from 0-100. (1) Compensation and Satisfaction, (2) Diversity and Rights, (3) Education and Work Conditions, (4) Community and Charity, (5) Human Rights, (6) Sustainability Integration.
Three scores under the governance bucket are averaged to yield the Fundata Governance Score for each fund from 0-100: (1) Board Effectiveness, (2) Management Ethics, (3) Disclosure and Accountability.
Powered by OWL Analytics. For more information, please contact Fundata Canada.
| Start Date | January 12, 2001 |
|---|---|
| Instrument Type | Mutual Fund |
| Share Class | Commission Based Advice |
| Legal Status | Trust |
| Sales Status | Open |
| Currency | CAD |
| Distribution Frequency | Annual |
| Assets ($mil) | $17 |
| FundServ Code | Load Code | Sales Status |
|---|---|---|
| FRC541 | ||
| FRC571 | ||
| FRC572 | ||
| FRC573 |
The Fund’s investment objective is to provide maximum total return, primarily through capital appreciation, by assuming a higher level of volatility than is ordinarily expected from developed markets outside North America by investing primarily in equity securities of emerging market countries. The investment objective cannot be changed unless unitholders of the Fund approve the change at a meeting.
This Fund invests primarily in shares of companies located in emerging market countries, which includes frontier markets. An emerging market country is a country with an economy that the World Bank or the United Nations considers to be emerging or developing. These countries generally include every country in the world except the United States, Canada, Japan, Hong Kong, Australia, New Zealand and most countries in Western Europe.
| Name | Start Date |
|---|---|
| Neuberger Berman Investment Advisers LLC | 06-22-2020 |
| Oaktree Capital Management | 06-22-2020 |
| Axiom International Investors LLC | 06-22-2020 |
| Russell Investments Canada Limited | 06-22-2020 |
| Coeli Frontier Markets AB | 06-22-2020 |
| RWC Asset Advisors (US) LLC | 06-22-2020 |
| Man Numeric Boston, MA | 07-29-2023 |
| Fund Manager | Russell Investments Canada Limited |
|---|---|
| Advisor | Russell Investments Canada Limited |
| Custodian | State Street Trust Company Canada |
| Registrar | International Financial Data Services (Canada) Ltd |
| Distributor | Russell Investments Canada Limited |
| Auditor | PriceWaterhouseCoopers LLP |
| RSP Eligible | Yes |
|---|---|
| PAC Allowed | Yes |
| PAC Initial Investment | 0 |
| PAC Subsequent | 0 |
| SWP Allowed | Yes |
| SWP Min Balance | 0 |
| SWP Min Withdrawal | 0 |
| MER | 2.64% |
|---|---|
| Management Fee | 2.20% |
| Load | Choice of Front or No Load |
| FE Max | 5.00% |
| DSC Max | - |
| Trailer Fee Max (FE) | 1.20% |
| Trailer Fee Max (DSC) | - |
| Trailer Fee Max (NL) | - |
| Trailer Fee Max (LL) | - |
Join Fund Library now and get free access to personalized features to help you manage your investments.
 Fund Library