Join Fund Library now and get free access to personalized features to help you manage your investments.
Financial Services Equity
 Click for more information on Fundata’s FundGrade
Click for more information on Fundata’s FundGrade.
 Click for more information on Fundata’s ESG Grade
Click for more information on Fundata’s ESG Grade.

2023
Click for more information on Fundata’s FundGrade
|
NAVPS (04-30-2024) |
$21.62 |
|---|---|
| Change |
-$0.09
(-0.40%)
|
As at March 31, 2024
As at January 31, 2024
As at February 29, 2024
Inception Return (January 25, 2001): 3.99%
| Row Heading | Return | Annualized Return | ||||||||||||
|---|---|---|---|---|---|---|---|---|---|---|---|---|---|---|
| 1 Mth | 3 Mth | 6 Mth | YTD | 1 Yr | 2 Yr | 3 Yr | 4 Yr | 5 Yr | 6 Yr | 7 Yr | 8 Yr | 9 Yr | 10 Yr | |
| Fund | 5.18% | 14.56% | 24.81% | 14.56% | 32.02% | 16.63% | 11.64% | 21.04% | 12.38% | 10.64% | 10.99% | 12.01% | 10.09% | 10.83% |
| Benchmark | 3.76% | 9.87% | 21.36% | 9.87% | 25.68% | 9.80% | 9.79% | 15.54% | 8.54% | 7.15% | 7.88% | 9.74% | 7.73% | 8.93% |
| Category Average | 5.09% | 20.74% | 20.74% | 8.28% | 21.50% | 4.12% | 6.40% | 16.72% | 8.69% | 6.85% | 7.60% | 9.48% | 7.82% | 8.14% |
| Category Rank | 28 / 77 | 7 / 76 | 17 / 76 | 7 / 76 | 10 / 71 | 8 / 60 | 7 / 57 | 8 / 52 | 6 / 52 | 7 / 47 | 7 / 42 | 8 / 34 | 9 / 34 | 8 / 32 |
| Quartile Ranking | 2 | 1 | 1 | 1 | 1 | 1 | 1 | 1 | 1 | 1 | 1 | 1 | 2 | 1 |
| Return % | Apr | May | Jun | Jul | Aug | Sep | Oct | Nov | Dec | Jan | Feb | Mar |
|---|---|---|---|---|---|---|---|---|---|---|---|---|
| Fund | 3.34% | -4.31% | 4.20% | 4.84% | -0.63% | -1.46% | -1.09% | 8.03% | 1.96% | 3.48% | 5.25% | 5.18% |
| Benchmark | 3.42% | -3.87% | 2.93% | 4.62% | -0.85% | -2.45% | -0.85% | 7.51% | 3.63% | 1.30% | 4.53% | 3.76% |
19.21% (November 2020)
-16.58% (January 2009)
| Return % | 2014 | 2015 | 2016 | 2017 | 2018 | 2019 | 2020 | 2021 | 2022 | 2023 |
|---|---|---|---|---|---|---|---|---|---|---|
| Fund | 11.97% | 18.08% | 2.34% | 15.02% | -2.86% | 12.66% | 5.69% | 20.40% | 3.34% | 12.42% |
| Benchmark | 14.35% | 14.20% | 6.34% | 15.24% | -4.99% | 19.43% | -5.24% | 22.05% | -5.68% | 13.41% |
| Category Average | 10.01% | 6.19% | 11.10% | 15.65% | -8.72% | 20.37% | 0.17% | 28.60% | -10.67% | 9.26% |
| Quartile Ranking | 3 | 2 | 4 | 2 | 1 | 4 | 1 | 4 | 1 | 2 |
| Category Rank | 16/ 31 | 12/ 34 | 27/ 34 | 19/ 42 | 7/ 46 | 50/ 50 | 9/ 52 | 57/ 57 | 7/ 57 | 27/ 66 |
20.40% (2021)
-2.86% (2018)
| Name | Percent |
|---|---|
| US Equity | 51.98 |
| International Equity | 40.08 |
| Canadian Equity | 6.02 |
| Cash and Equivalents | 1.93 |
| Other | -0.01 |
| Name | Percent |
|---|---|
| Financial Services | 94.00 |
| Industrial Services | 2.65 |
| Cash and Cash Equivalent | 1.92 |
| Real Estate | 0.70 |
| Energy | 0.65 |
| Other | 0.08 |
| Name | Percent |
|---|---|
| North America | 59.71 |
| Europe | 23.80 |
| Asia | 12.75 |
| Latin America | 3.15 |
| Africa and Middle East | 0.53 |
| Other | 0.06 |
| Name | Percent |
|---|---|
| Visa Inc Cl A | 5.37 |
| JPMorgan Chase & Co | 5.14 |
| Mastercard Inc Cl A | 4.75 |
| Berkshire Hathaway Inc Cl B | 4.07 |
| Wells Fargo & Co | 2.78 |
| S&P Global Inc | 2.37 |
| Mitsubishi UFJ Financial Group Inc | 2.21 |
| Bank of America Corp | 1.75 |
| Sumitomo Mitsui Financial Group Inc | 1.73 |
| Chubb Ltd | 1.67 |

IG Mackenzie Global Financial Services Fund Series C
Median
Other - Financial Services Equity
| Standard Deviation | 16.32% | 18.82% | 15.43% |
|---|---|---|---|
| Beta | 1.09% | 1.09% | 1.05% |
| Alpha | 0.01% | 0.03% | 0.02% |
| Rsquared | 0.80% | 0.83% | 0.84% |
| Sharpe | 0.60% | 0.61% | 0.66% |
| Sortino | 0.90% | 0.92% | 0.88% |
| Treynor | 0.09% | 0.11% | 0.10% |
| Tax Efficiency | 92.10% | 95.06% | 96.63% |
| Volatility |

|
|
|

| Key Ratio | 1 Yr | 3 Yr | 5 Yr | 10 Yr |
|---|---|---|---|---|
| Standard Deviation | 12.37% | 16.32% | 18.82% | 15.43% |
| Beta | 1.02% | 1.09% | 1.09% | 1.05% |
| Alpha | 0.05% | 0.01% | 0.03% | 0.02% |
| Rsquared | 0.92% | 0.80% | 0.83% | 0.84% |
| Sharpe | 1.94% | 0.60% | 0.61% | 0.66% |
| Sortino | 5.03% | 0.90% | 0.92% | 0.88% |
| Treynor | 0.23% | 0.09% | 0.11% | 0.10% |
| Tax Efficiency | 90.76% | 92.10% | 95.06% | 96.63% |
The E, S, and G scores are averaged for each security in the portfolio, to arrive at an ESG score for each security. We take the portfolio weighted average of the ESG scores for each fund and rank them against their peers to arrive at the Fundata ESG Score from 0-100.
Three scores under the Environment bucket are averaged to yield the Fundata Environment Score for each fund from 0-100: (1) Pollution Prevention, (2) Environmental Transparency, (3) Resource Efficiency.
Six scores under the Social bucket are averaged to yield the Fundata Social Score for each fund from 0-100. (1) Compensation and Satisfaction, (2) Diversity and Rights, (3) Education and Work Conditions, (4) Community and Charity, (5) Human Rights, (6) Sustainability Integration.
Three scores under the governance bucket are averaged to yield the Fundata Governance Score for each fund from 0-100: (1) Board Effectiveness, (2) Management Ethics, (3) Disclosure and Accountability.
Powered by OWL Analytics. For more information, please contact Fundata Canada.
| Start Date | January 25, 2001 |
|---|---|
| Instrument Type | Mutual Fund |
| Share Class | Commission Based Advice |
| Legal Status | Trust |
| Sales Status | Partially Open |
| Currency | CAD |
| Distribution Frequency | Annual |
| Assets ($mil) | $202 |
| FundServ Code | Load Code | Sales Status |
|---|---|---|
| IGI174 | ||
| IGI175 |
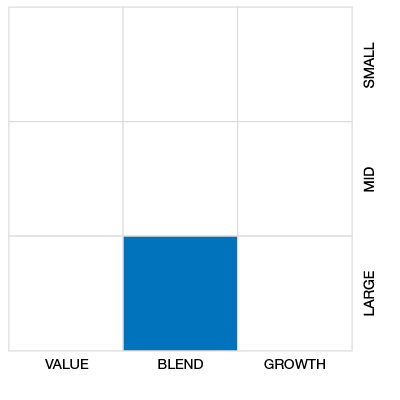
The Fund aims to provide long-term capital growth with an income component via dividends, by investing primarily in large leading global financial services providers and the companies that provide technology and support services to these companies. The Fund may also invest a portion of its assets in medium and small cap financial services companies and/or support services or companies engaged in providing financial services electronically via the Internet and/or proprietary online access.
The Fund expects to focus on investing primarily in the common shares of companies in industries such as banking, insurance, asset management and stock brokerages throughout the world. There is expected to be a “best-in-class” sector approach taken with emphasis on large Capitalization corporations. The Fund uses a blend of growth and value equity management styles, seeking to invest in high-quality companies that are undervalued and have attractive growth prospects.
| Name | Start Date |
|---|---|
| Arup Datta | 02-01-2023 |
| Mackenzie Financial Corporation | 02-01-2023 |
| Fund Manager | I.G. Investment Management, Ltd. |
|---|---|
| Advisor | I.G. Investment Management, Ltd. |
| Custodian | Canadian Imperial Bank of Commerce |
| Registrar | I.G. Investment Management, Ltd. |
| Distributor | Investors Group Financial Services Inc. |
| Auditor | Deloitte LLP |
| RSP Eligible | Yes |
|---|---|
| PAC Allowed | Yes |
| PAC Initial Investment | 50 |
| PAC Subsequent | 50 |
| SWP Allowed | Yes |
| SWP Min Balance | 250 |
| SWP Min Withdrawal | 100 |
| MER | 2.93% |
|---|---|
| Management Fee | 1.95% |
| Load | Choice of Front or Back |
| FE Max | - |
| DSC Max | 1.50% |
| Trailer Fee Max (FE) | - |
| Trailer Fee Max (DSC) | 0.70% |
| Trailer Fee Max (NL) | - |
| Trailer Fee Max (LL) | - |
Join Fund Library now and get free access to personalized features to help you manage your investments.
 Fund Library