Join Fund Library now and get free access to personalized features to help you manage your investments.
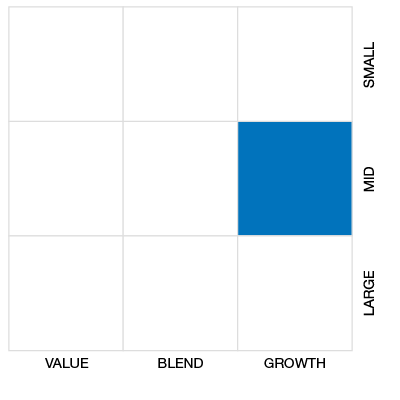
Cdn Foc Small/Mid Cap Eq
 Click for more information on Fundata’s FundGrade
Click for more information on Fundata’s FundGrade.
 Click for more information on Fundata’s ESG Grade
Click for more information on Fundata’s ESG Grade.
|
NAVPS (05-01-2024) |
$26.58 |
|---|---|
| Change |
$0.06
(0.24%)
|
As at March 31, 2024
As at January 31, 2024
As at February 29, 2024
Inception Return (January 15, 2001): 5.42%
| Row Heading | Return | Annualized Return | ||||||||||||
|---|---|---|---|---|---|---|---|---|---|---|---|---|---|---|
| 1 Mth | 3 Mth | 6 Mth | YTD | 1 Yr | 2 Yr | 3 Yr | 4 Yr | 5 Yr | 6 Yr | 7 Yr | 8 Yr | 9 Yr | 10 Yr | |
| Fund | 1.85% | 6.78% | 15.09% | 6.78% | 8.65% | 0.36% | 0.85% | 11.29% | 6.96% | 5.66% | 4.41% | 5.60% | 5.10% | 5.30% |
| Benchmark | 6.22% | 7.87% | 15.65% | 7.87% | 11.58% | 0.96% | 4.53% | 20.26% | 8.17% | 6.65% | 5.62% | 8.00% | 6.54% | 5.76% |
| Category Average | 3.35% | 16.52% | 16.52% | 8.19% | 12.63% | 2.82% | 2.99% | 17.63% | 9.94% | 8.76% | 8.17% | 9.31% | 7.63% | 7.33% |
| Category Rank | 41 / 52 | 39 / 52 | 34 / 52 | 39 / 52 | 41 / 52 | 41 / 52 | 45 / 52 | 46 / 52 | 37 / 49 | 30 / 40 | 29 / 33 | 28 / 32 | 25 / 31 | 19 / 25 |
| Quartile Ranking | 4 | 3 | 3 | 3 | 4 | 4 | 4 | 4 | 4 | 3 | 4 | 4 | 4 | 4 |
| Return % | Apr | May | Jun | Jul | Aug | Sep | Oct | Nov | Dec | Jan | Feb | Mar |
|---|---|---|---|---|---|---|---|---|---|---|---|---|
| Fund | 0.42% | -2.28% | 1.84% | -0.11% | -0.56% | -4.88% | -3.48% | 8.10% | 3.30% | 1.70% | 3.08% | 1.85% |
| Benchmark | -0.62% | -3.64% | 1.79% | 5.38% | -1.04% | -5.08% | -2.79% | 5.65% | 4.40% | -0.78% | 2.34% | 6.22% |
15.37% (April 2020)
-18.31% (March 2020)
| Return % | 2014 | 2015 | 2016 | 2017 | 2018 | 2019 | 2020 | 2021 | 2022 | 2023 |
|---|---|---|---|---|---|---|---|---|---|---|
| Fund | 4.28% | 9.89% | 12.86% | 1.39% | -12.62% | 24.04% | 22.42% | 8.06% | -14.98% | 4.36% |
| Benchmark | 1.95% | -3.54% | 27.23% | 7.15% | -14.41% | 17.42% | 12.92% | 18.74% | -10.51% | 8.17% |
| Category Average | 6.09% | -2.19% | 16.27% | 9.79% | -11.20% | 21.83% | 30.06% | 13.94% | -13.64% | 7.90% |
| Quartile Ranking | 4 | 1 | 4 | 4 | 4 | 1 | 1 | 4 | 4 | 4 |
| Category Rank | 24/ 25 | 6/ 29 | 28/ 32 | 33/ 33 | 34/ 40 | 8/ 43 | 13/ 52 | 52/ 52 | 41/ 52 | 41/ 52 |
24.04% (2019)
-14.98% (2022)
| Name | Percent |
|---|---|
| Canadian Equity | 68.13 |
| US Equity | 25.30 |
| Income Trust Units | 4.94 |
| Cash and Equivalents | 1.22 |
| International Equity | 0.41 |
| Name | Percent |
|---|---|
| Real Estate | 15.63 |
| Financial Services | 14.29 |
| Technology | 13.29 |
| Consumer Services | 10.83 |
| Industrial Services | 9.21 |
| Other | 36.75 |
| Name | Percent |
|---|---|
| North America | 99.59 |
| Europe | 0.41 |
| Name | Percent |
|---|---|
| Boyd Group Services Inc | 2.91 |
| EQB Inc | 2.71 |
| Element Fleet Management Corp | 2.57 |
| Stantec Inc | 2.56 |
| Descartes Systems Group Inc | 2.53 |
| Savaria Corp | 2.34 |
| ATS Corp | 2.14 |
| Definity Financial Corp | 2.11 |
| Dream Industrial REIT - Units | 2.05 |
| Stella-Jones Inc | 1.98 |

Canada Life Canadian Small-Mid Cap Fund A
Median
Other - Cdn Foc Small/Mid Cap Eq
| Standard Deviation | 13.72% | 16.30% | 13.39% |
|---|---|---|---|
| Beta | 0.72% | 0.66% | 0.65% |
| Alpha | -0.02% | 0.01% | 0.01% |
| Rsquared | 0.64% | 0.75% | 0.69% |
| Sharpe | -0.06% | 0.38% | 0.35% |
| Sortino | -0.13% | 0.44% | 0.33% |
| Treynor | -0.01% | 0.09% | 0.07% |
| Tax Efficiency | 89.74% | 99.13% | 98.61% |
| Volatility |

|

|
|

| Key Ratio | 1 Yr | 3 Yr | 5 Yr | 10 Yr |
|---|---|---|---|---|
| Standard Deviation | 11.94% | 13.72% | 16.30% | 13.39% |
| Beta | 0.70% | 0.72% | 0.66% | 0.65% |
| Alpha | 0.01% | -0.02% | 0.01% | 0.01% |
| Rsquared | 0.61% | 0.64% | 0.75% | 0.69% |
| Sharpe | 0.35% | -0.06% | 0.38% | 0.35% |
| Sortino | 0.87% | -0.13% | 0.44% | 0.33% |
| Treynor | 0.06% | -0.01% | 0.09% | 0.07% |
| Tax Efficiency | 100.00% | 89.74% | 99.13% | 98.61% |
The E, S, and G scores are averaged for each security in the portfolio, to arrive at an ESG score for each security. We take the portfolio weighted average of the ESG scores for each fund and rank them against their peers to arrive at the Fundata ESG Score from 0-100.
Three scores under the Environment bucket are averaged to yield the Fundata Environment Score for each fund from 0-100: (1) Pollution Prevention, (2) Environmental Transparency, (3) Resource Efficiency.
Six scores under the Social bucket are averaged to yield the Fundata Social Score for each fund from 0-100. (1) Compensation and Satisfaction, (2) Diversity and Rights, (3) Education and Work Conditions, (4) Community and Charity, (5) Human Rights, (6) Sustainability Integration.
Three scores under the governance bucket are averaged to yield the Fundata Governance Score for each fund from 0-100: (1) Board Effectiveness, (2) Management Ethics, (3) Disclosure and Accountability.
Powered by OWL Analytics. For more information, please contact Fundata Canada.
| Start Date | January 15, 2001 |
|---|---|
| Instrument Type | Mutual Fund |
| Share Class | Commission Based Advice |
| Legal Status | Trust |
| Sales Status | Open |
| Currency | CAD |
| Distribution Frequency | Annual |
| Assets ($mil) | $83 |
| FundServ Code | Load Code | Sales Status |
|---|---|---|
| MAX1253 | ||
| MAX1353 | ||
| MAX1453 |
The Fund seeks to provide above-average long-term capital appreciation by investing primarily in publicly traded equity issues of small to mid capitalized Canadian companies with above average growth potential. Any proposed change to the fundamental investment objectives of the Fund must be approved by a majority of the votes cast at a meeting of the Fund’s investors called for that purpose.
The focus is on selecting stocks with strong earnings growth, healthy fundamentals and attractive valuation relative to industry comparables and historic norms. The asset allocation guidelines for the Fund are as follows: Canadian stocks: 70% to 100%, Foreign stocks: 0% to 30%, Short-term fixed income securities: 0% to 30%. These are guidelines only; the Fund’s actual allocation to a particular asset class may deviate from these guidelines at the discretion of the sub-advisor.
| Name | Start Date |
|---|---|
| Mackenzie Financial Corporation | 08-19-2022 |
| Canada Life Investment Management Ltd. | 08-19-2022 |
| Fund Manager | Canada Life Investment Management Ltd. |
|---|---|
| Advisor | Canada Life Investment Management Ltd. |
| Custodian | Canadian Imperial Bank of Commerce |
| Registrar | Mackenzie Financial Corporation |
| Distributor | Quadrus Investment Services Limited |
| Auditor | Deloitte LLP |
| RSP Eligible | Yes |
|---|---|
| PAC Allowed | Yes |
| PAC Initial Investment | 500 |
| PAC Subsequent | 25 |
| SWP Allowed | Yes |
| SWP Min Balance | 5,000 |
| SWP Min Withdrawal | 0 |
| MER | 2.53% |
|---|---|
| Management Fee | 2.00% |
| Load | Choice of Front or No Load |
| FE Max | 5.00% |
| DSC Max | - |
| Trailer Fee Max (FE) | 1.00% |
| Trailer Fee Max (DSC) | - |
| Trailer Fee Max (NL) | - |
| Trailer Fee Max (LL) | - |
Join Fund Library now and get free access to personalized features to help you manage your investments.
 Fund Library