Join Fund Library now and get free access to personalized features to help you manage your investments.
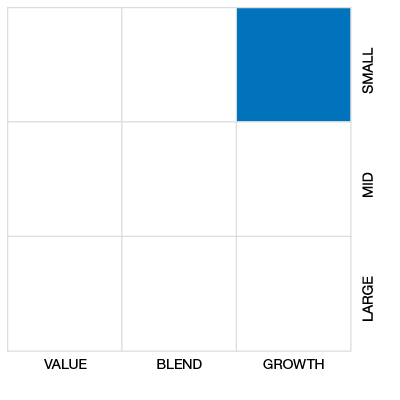
Cdn Small/Mid Cap Equity
 Click for more information on Fundata’s FundGrade
Click for more information on Fundata’s FundGrade.
 Click for more information on Fundata’s ESG Grade
Click for more information on Fundata’s ESG Grade.
|
NAVPS (05-01-2024) |
$65.90 |
|---|---|
| Change |
-$0.05
(-0.08%)
|
As at March 31, 2024
As at March 31, 2024
As at February 29, 2024
Inception Return (February 25, 1988): 8.61%
| Row Heading | Return | Annualized Return | ||||||||||||
|---|---|---|---|---|---|---|---|---|---|---|---|---|---|---|
| 1 Mth | 3 Mth | 6 Mth | YTD | 1 Yr | 2 Yr | 3 Yr | 4 Yr | 5 Yr | 6 Yr | 7 Yr | 8 Yr | 9 Yr | 10 Yr | |
| Fund | 1.71% | 8.69% | 19.66% | 8.69% | 18.38% | 2.22% | 4.90% | 17.54% | 7.19% | 5.48% | 3.57% | 4.70% | 3.16% | 4.16% |
| Benchmark | 7.49% | 7.92% | 14.37% | 7.92% | 8.22% | -2.72% | 3.99% | 22.48% | 7.82% | 6.15% | 4.23% | 7.10% | 5.60% | 3.95% |
| Category Average | 2.61% | 14.11% | 14.11% | 6.51% | 10.12% | 0.74% | 4.35% | 17.73% | 7.77% | 6.09% | 4.99% | 6.38% | 4.84% | 4.30% |
| Category Rank | 142 / 219 | 58 / 216 | 22 / 215 | 58 / 216 | 18 / 215 | 85 / 213 | 102 / 203 | 108 / 195 | 121 / 187 | 115 / 179 | 132 / 169 | 140 / 167 | 123 / 143 | 107 / 138 |
| Quartile Ranking | 3 | 2 | 1 | 2 | 1 | 2 | 3 | 3 | 3 | 3 | 4 | 4 | 4 | 4 |
| Return % | Apr | May | Jun | Jul | Aug | Sep | Oct | Nov | Dec | Jan | Feb | Mar |
|---|---|---|---|---|---|---|---|---|---|---|---|---|
| Fund | 0.37% | -0.27% | 2.83% | 2.65% | -1.45% | -5.00% | -2.93% | 6.71% | 6.29% | 3.70% | 3.05% | 1.71% |
| Benchmark | -1.16% | -4.06% | 0.59% | 6.09% | -1.31% | -5.24% | -2.58% | 4.84% | 3.76% | -0.37% | 0.77% | 7.49% |
20.16% (April 2020)
-24.83% (March 2020)
| Return % | 2014 | 2015 | 2016 | 2017 | 2018 | 2019 | 2020 | 2021 | 2022 | 2023 |
|---|---|---|---|---|---|---|---|---|---|---|
| Fund | 13.06% | -3.07% | 18.10% | -4.30% | -20.72% | 17.92% | 12.66% | 20.57% | -16.25% | 10.20% |
| Benchmark | -2.34% | -13.31% | 38.48% | 2.75% | -18.17% | 15.84% | 12.87% | 20.27% | -9.29% | 4.79% |
| Category Average | 3.45% | -6.13% | 18.01% | 3.43% | -15.15% | 16.59% | 11.91% | 22.35% | -11.32% | 6.49% |
| Quartile Ranking | 1 | 3 | 3 | 4 | 4 | 3 | 3 | 3 | 3 | 2 |
| Category Rank | 24/ 137 | 75/ 142 | 103/ 164 | 169/ 169 | 170/ 179 | 111/ 186 | 117/ 191 | 136/ 203 | 150/ 212 | 64/ 215 |
20.57% (2021)
-20.72% (2018)
| Name | Percent |
|---|---|
| Canadian Equity | 85.99 |
| US Equity | 7.07 |
| Cash and Equivalents | 3.63 |
| International Equity | 2.03 |
| Income Trust Units | 1.29 |
| Other | -0.01 |
| Name | Percent |
|---|---|
| Energy | 14.11 |
| Consumer Services | 12.59 |
| Real Estate | 11.54 |
| Financial Services | 11.16 |
| Industrial Goods | 10.85 |
| Other | 39.75 |
| Name | Percent |
|---|---|
| North America | 97.98 |
| Asia | 2.03 |
| Other | -0.01 |
| Name | Percent |
|---|---|
| Mainstreet Equity Corp | 4.56 |
| GDI Integrated Facility Services Inc | 3.76 |
| Cash and Cash Equivalents | 3.63 |
| Richelieu Hardware Ltd | 3.53 |
| EQB Inc | 3.42 |
| Heroux Devtek Inc | 3.40 |
| Pet Valu Holdings Ltd | 3.25 |
| Topaz Energy Corp | 3.23 |
| goeasy Ltd | 2.92 |
| Boyd Group Services Inc | 2.83 |

NBI Small Cap Fund Investor Series
Median
Other - Cdn Small/Mid Cap Equity
| Standard Deviation | 14.36% | 19.69% | 16.27% |
|---|---|---|---|
| Beta | 0.66% | 0.71% | 0.70% |
| Alpha | 0.02% | 0.01% | 0.01% |
| Rsquared | 0.59% | 0.81% | 0.76% |
| Sharpe | 0.22% | 0.36% | 0.25% |
| Sortino | 0.28% | 0.42% | 0.21% |
| Treynor | 0.05% | 0.10% | 0.06% |
| Tax Efficiency | 99.81% | 99.91% | 90.50% |
| Volatility |

|

|
|

| Key Ratio | 1 Yr | 3 Yr | 5 Yr | 10 Yr |
|---|---|---|---|---|
| Standard Deviation | 12.15% | 14.36% | 19.69% | 16.27% |
| Beta | 0.62% | 0.66% | 0.71% | 0.70% |
| Alpha | 0.12% | 0.02% | 0.01% | 0.01% |
| Rsquared | 0.51% | 0.59% | 0.81% | 0.76% |
| Sharpe | 1.06% | 0.22% | 0.36% | 0.25% |
| Sortino | 2.29% | 0.28% | 0.42% | 0.21% |
| Treynor | 0.21% | 0.05% | 0.10% | 0.06% |
| Tax Efficiency | 100.00% | 99.81% | 99.91% | 90.50% |
The E, S, and G scores are averaged for each security in the portfolio, to arrive at an ESG score for each security. We take the portfolio weighted average of the ESG scores for each fund and rank them against their peers to arrive at the Fundata ESG Score from 0-100.
Three scores under the Environment bucket are averaged to yield the Fundata Environment Score for each fund from 0-100: (1) Pollution Prevention, (2) Environmental Transparency, (3) Resource Efficiency.
Six scores under the Social bucket are averaged to yield the Fundata Social Score for each fund from 0-100. (1) Compensation and Satisfaction, (2) Diversity and Rights, (3) Education and Work Conditions, (4) Community and Charity, (5) Human Rights, (6) Sustainability Integration.
Three scores under the governance bucket are averaged to yield the Fundata Governance Score for each fund from 0-100: (1) Board Effectiveness, (2) Management Ethics, (3) Disclosure and Accountability.
Powered by OWL Analytics. For more information, please contact Fundata Canada.
| Start Date | February 25, 1988 |
|---|---|
| Instrument Type | Mutual Fund |
| Share Class | Commission Based Advice |
| Legal Status | Trust |
| Sales Status | Open |
| Currency | CAD |
| Distribution Frequency | Annual |
| Assets ($mil) | $89 |
| FundServ Code | Load Code | Sales Status |
|---|---|---|
| NBC841 |
The NBI Small Cap Fund’s investment objective is to provide long-term capital growth and preservation. The fund invests primarily in common shares of companies chosen for their growth potential. The fund may also invest in money market instruments and securities of Canadian federal and provincial governments. The fund makes investments in small capitalization companies which provide you with additional dynamic growth potential for a diversified portfolio.
The fund invests mainly in small capitalization Canadian equities. The fund may also invest in: equity securities of Canadian mid and large capitalization companies; rights and warrants; equity securities of foreign companies. The portfolio sub-advisor may choose to invest approximately 45% of the net assets of the fund in securities of underlying mutual funds managed by the manager or by third parties, including exchange-traded funds.
| Name | Start Date |
|---|---|
| Marc Lecavalier | 06-17-2022 |
| National Bank Trust Inc. | 06-17-2022 |
| Fund Manager | National Bank Investments Inc. |
|---|---|
| Advisor | National Bank Trust Inc. |
| Custodian | Natcan Trust Company |
| Registrar | Natcan Trust Company |
| Distributor | National Bank Investments |
| Auditor | Raymond Chabot Grant Thornton LLP |
| RSP Eligible | Yes |
|---|---|
| PAC Allowed | Yes |
| PAC Initial Investment | 25 |
| PAC Subsequent | 25 |
| SWP Allowed | Yes |
| SWP Min Balance | 10,000 |
| SWP Min Withdrawal | 50 |
| MER | 2.19% |
|---|---|
| Management Fee | 1.75% |
| Load | No Load |
| FE Max | - |
| DSC Max | - |
| Trailer Fee Max (FE) | - |
| Trailer Fee Max (DSC) | - |
| Trailer Fee Max (NL) | 1.00% |
| Trailer Fee Max (LL) | - |
Join Fund Library now and get free access to personalized features to help you manage your investments.
 Fund Library